- Search Forex Factory
- 241 Results
-
 Karpa replied Jul 20, 2018
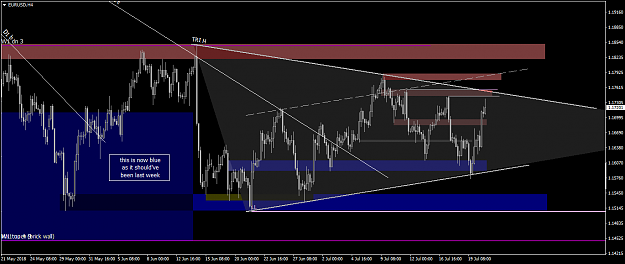
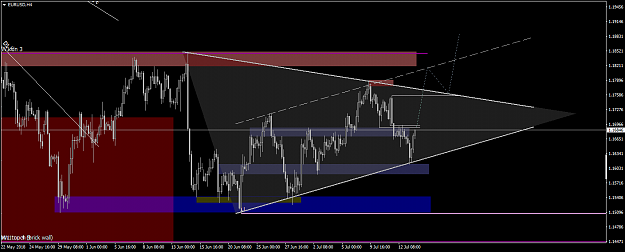
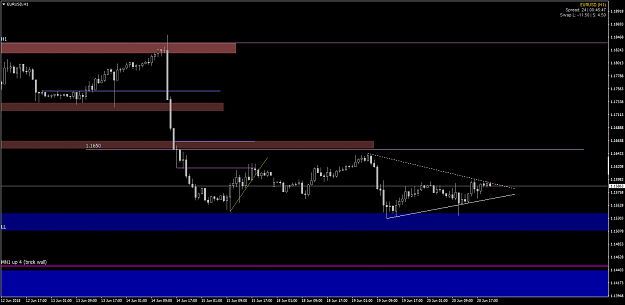
Hi all.. been away I see a range and a triangular convergence OR upward channel don't want to comment on friday's candle Triangular formations always breakout and I'll be buying dips.
EURUSD only
- Karpa replied Jul 14, 2018
Now that you mention SHS I see it myself I'm biased long also b/c of futures but it's what it is (correction: COT Jul/10 is EUR long 24K vs 37K long last week) and was expecting a bigger drop on friday.. all adds up I was to comment on friday's ...
EURUSD only
- Karpa replied Jul 14, 2018
I see a range and a triangular convergence OR upward channel a hammer candle on friday Triangular formations always breakout and I'll be buying dips.
EURUSD only
- Karpa replied Jul 12, 2018
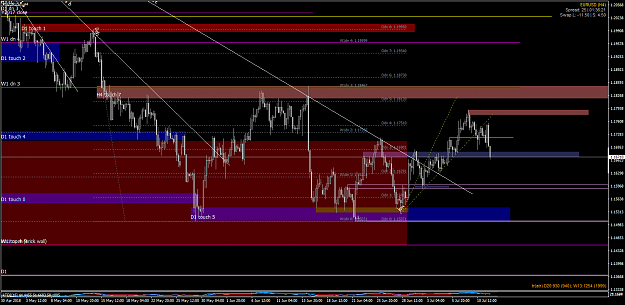
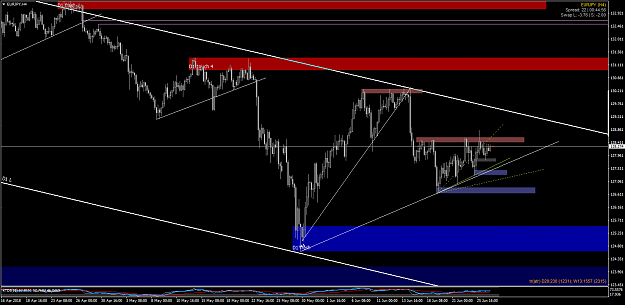
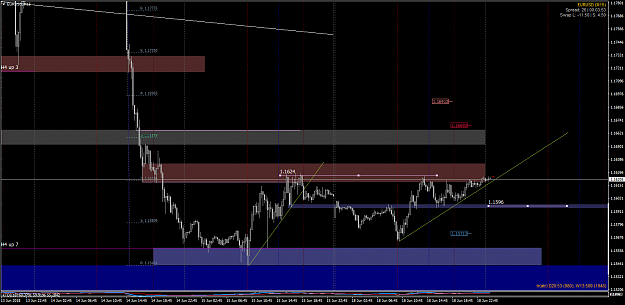
Hello Sirs sorry for the late response my plan was to add shorts at the plum-colored 1.172x but asia couldn't get there PA looks like a bearish flag (or drop/base/drop) image the slanted dotted lines are my magic TL breakout to the upside.. work ...
Cesarnc's market talk, gossips, rumours & fun

- Karpa replied Jul 11, 2018
got some levels
Cesarnc's market talk, gossips, rumours & fun Trade safe Sir
- Karpa replied Jun 28, 2018
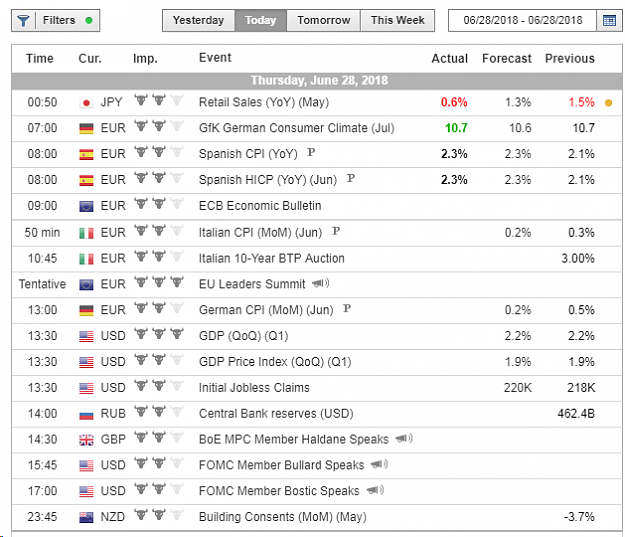
I was expecting bad data from EZ, after yd's move but so far Germany Consumer Climate came out marginally green and Spain's CPI came out inline with expectations E/U is trading at, what I think, a very strong support level not a value to sell imho ...
Cesarnc's market talk, gossips, rumours & fun
- Karpa replied Jun 27, 2018
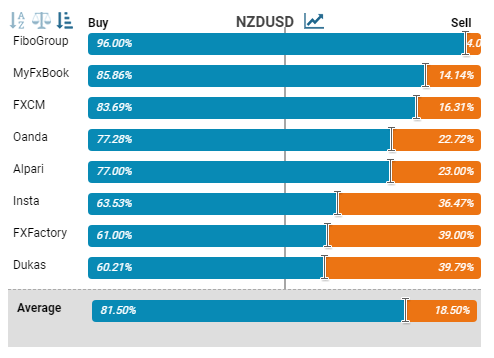
we could have a stretching to the downside long squeeze retail is globally on the long side
NZD/USD
- Karpa replied Jun 27, 2018
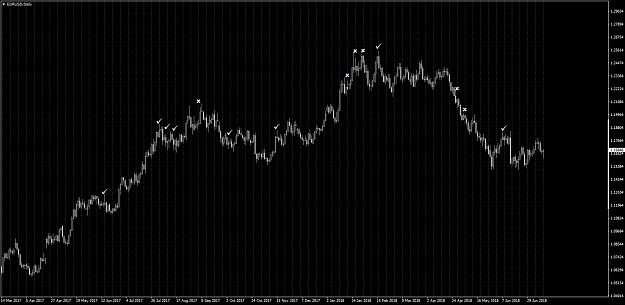
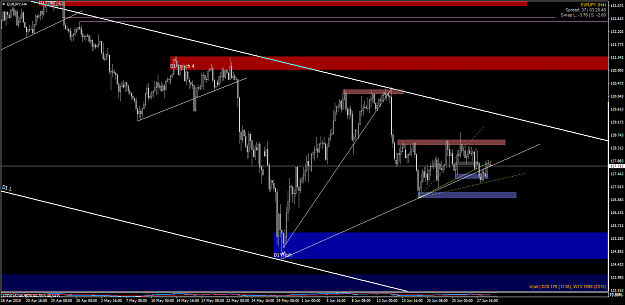
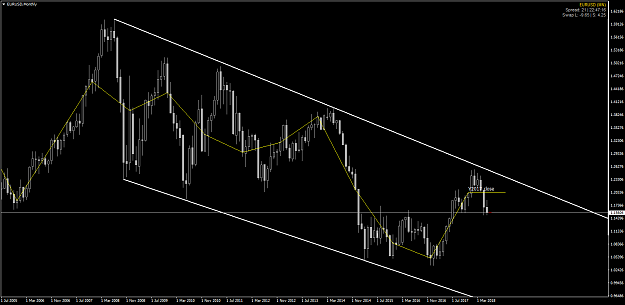
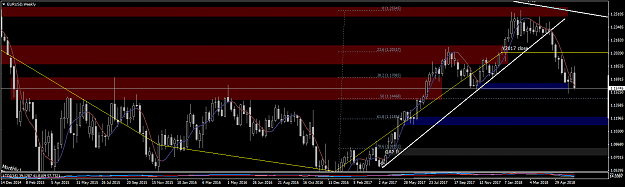
here's my montly chart. will the euro suddenly strengthen? will the USD suddenly weaken? why?
Cesarnc's market talk, gossips, rumours & fun
- Karpa replied Jun 21, 2018
a pullback would be nice unless the bears take the day off
Cesarnc's market talk, gossips, rumours & fun image
image
- Karpa replied Jun 19, 2018
Breakout was not a fat candle may still enter depending on london PA
Cesarnc's market talk, gossips, rumours & fun
- Karpa replied Jun 18, 2018
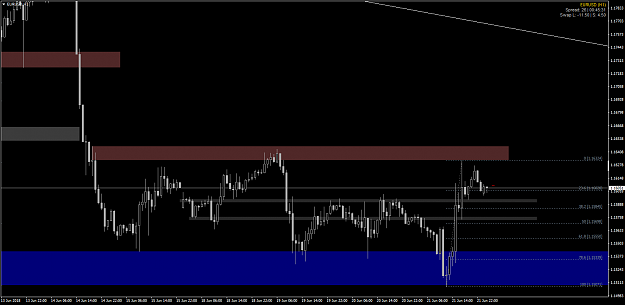
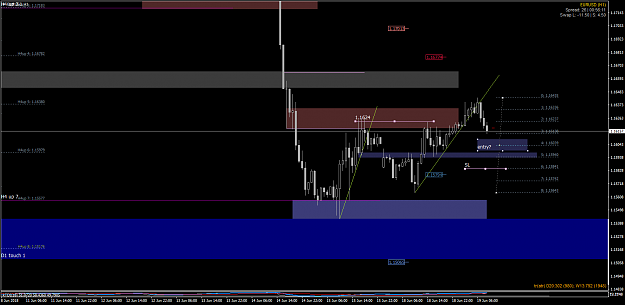
I'm betting on price breaking 1.1624x and 1.1596x will hold if visited Comments are welcome
Cesarnc's market talk, gossips, rumours & fun image would buy 1.1596 with 20 pip stop if 1.1624 breaks with a hourly 20+ pip candle in the first place
- Karpa replied Jun 15, 2018
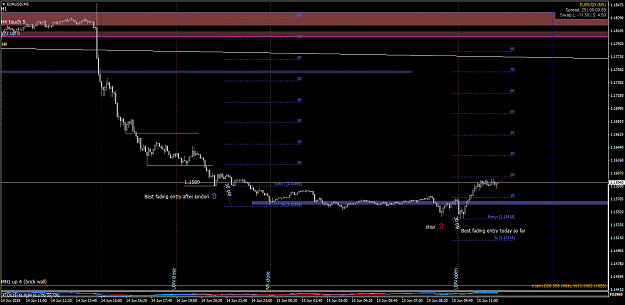
the fade exercise has now locked 1R, that's 30 pips As per shorts, watching levels 1) and 2) and the diagonal line
Cesarnc's market talk, gossips, rumours & fun
- Karpa replied Jun 15, 2018
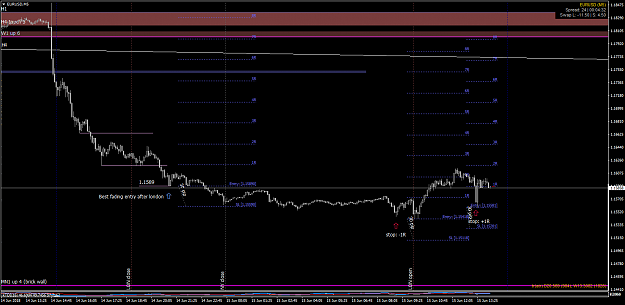
1.15418 was stopped: +1R Net: BE - swap New entry: 1.15581 stop at 1.15581
Cesarnc's market talk, gossips, rumours & fun
- Karpa replied Jun 15, 2018
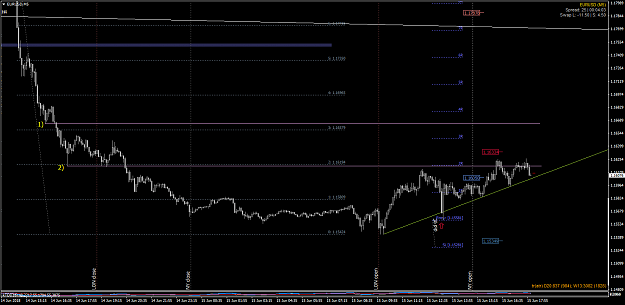
this is how I see fading used a 30 pip stop, that's 1/3 daily range average.. let's see what happens image Edit: forgot the rules Let's stick to the M5 chart b/c we're hypotetically fading so we need to sit in front of the chart and monitor PA ...
Cesarnc's market talk, gossips, rumours & fun
- Karpa replied Jun 14, 2018
I keep looking at this 50% but it's at the bottom of the brick wall that kept e/u below 1.15 for 128 weeks This very strong resistance should now become a very strong support right?
Cesarnc's market talk, gossips, rumours & fun
- Karpa replied Jun 13, 2018
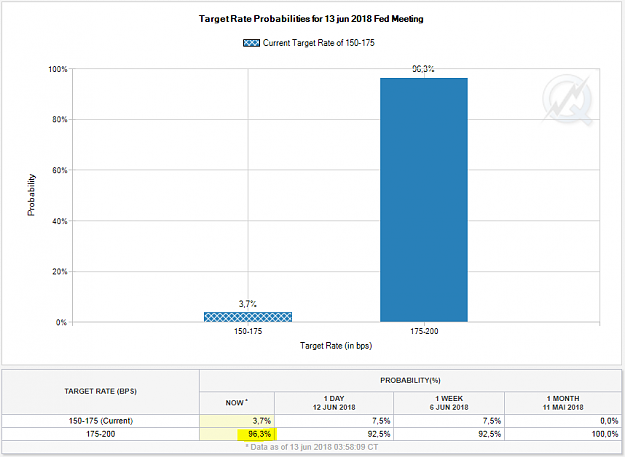
From CME FedWatch Tool ( url ) probability of FED hiking today is 96.3% vs 92.5% yesterday and 100% a month ago image
The Club!