- Search Forex Factory
- 1,354 Results (1 Thread , 1,353 Replies )
-
 JimmyC replied Jan 17, 2022
GU Daily, Bit overbought, trend switching bearish, longer view would tend to the downside
Cable Update (GBPUSD)
- JimmyC replied Mar 11, 2020
GBP.... Master trend image 200 days sma above the 50 day sma = downtrend. scalp long if you have solid discipline by all means but the noobies.... are playing with their accounts like Mr I lost 10% of my account yesterday because of incorrect lot ...
Cable Update (GBPUSD)
- JimmyC replied Mar 10, 2020
image Supports and target would be around the 200 days sma
Cable Update (GBPUSD)
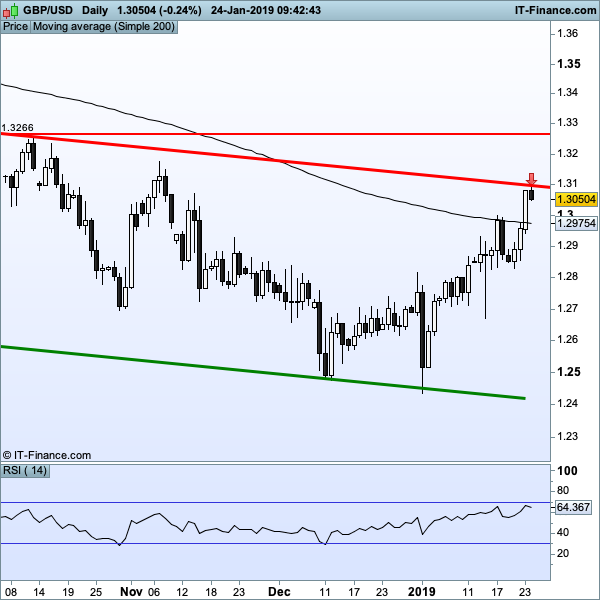
- JimmyC replied Jan 24, 2019
And bounce. Maybe down to test the 200? image image
Cable Update (GBPUSD)
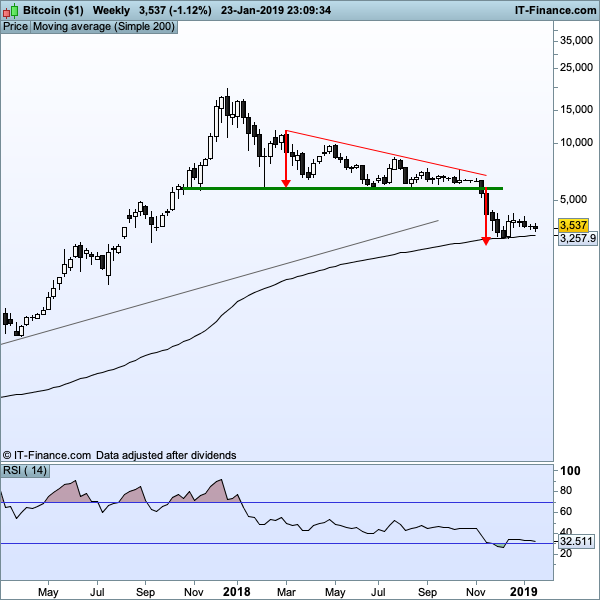
- JimmyC replied Jan 23, 2019
Remember when the local shop owner was bullish on Bitcoin? I see its bumping on the 200 week sma... image
Mr. Scott's Crayon Thread
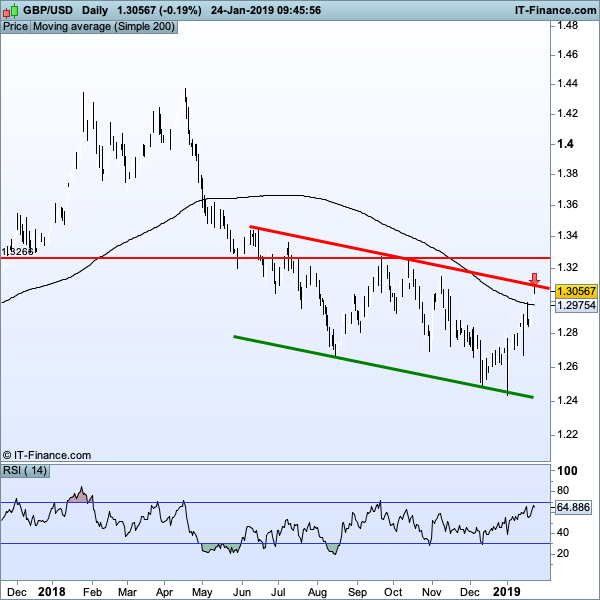
- JimmyC replied Jan 23, 2019
Cable Daily. I note some exuberance on the bullish side, good luck lads. -Price has traded above the 200 sma, for at least an ok bullish break. Some caution to the upside Price appears to be trading in a descending channel Notable overhead ...
Cable Update (GBPUSD)
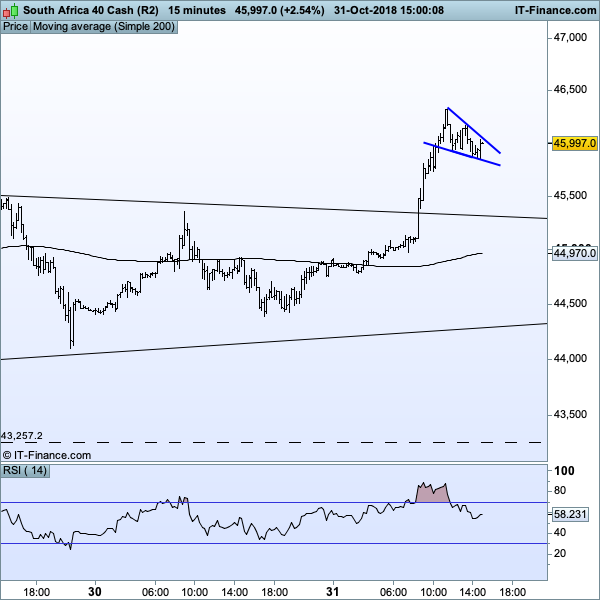
- JimmyC replied Oct 24, 2018
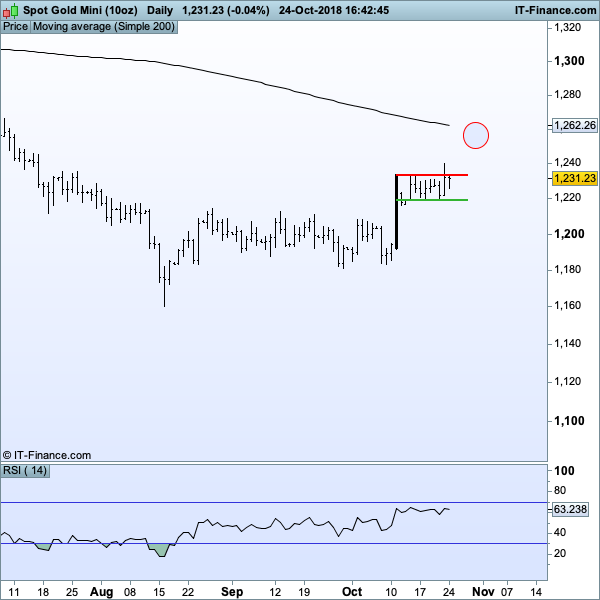
Gold image Initial breakout failed to be definitive, moves to the upside have some potential here.
Mr. Scott's Crayon Thread
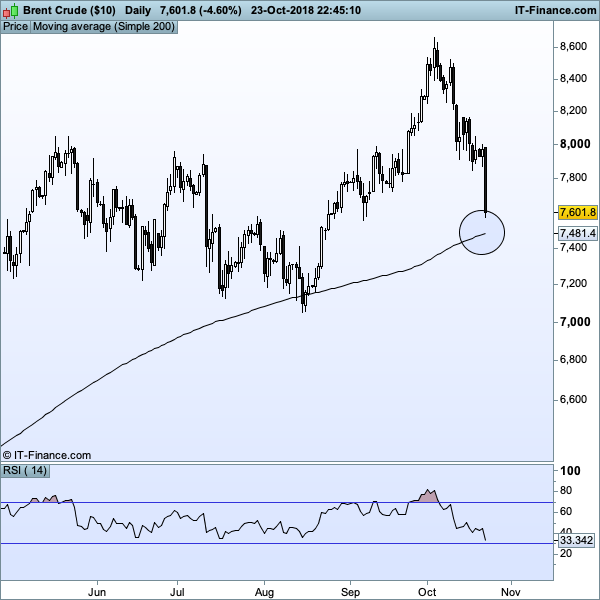
- JimmyC replied Oct 23, 2018
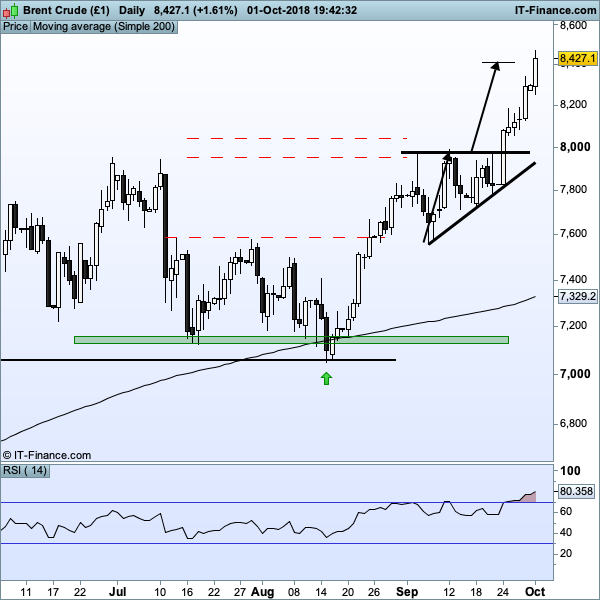
Brent crude (LCO) Is looking interesting... image
Mr. Scott's Crayon Thread
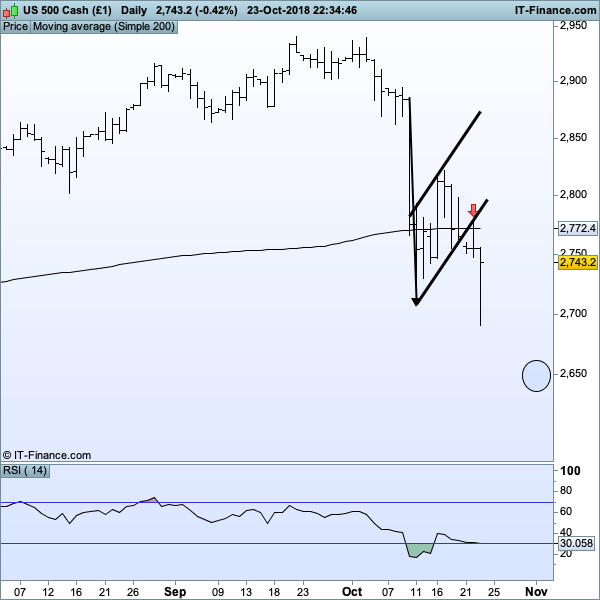
- JimmyC replied Oct 23, 2018
Let's say we take an old-school approach... then she's not done... If I was a day trader, I, think I'd be looking to short again... image
Mr. Scott's Crayon Thread
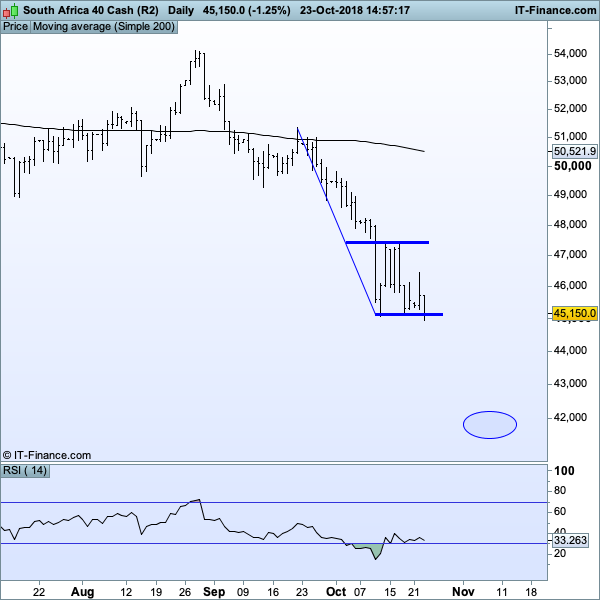
- JimmyC replied Oct 23, 2018
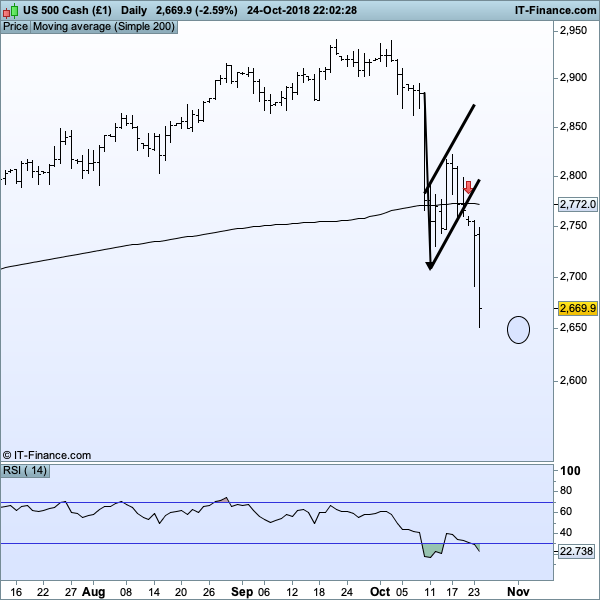
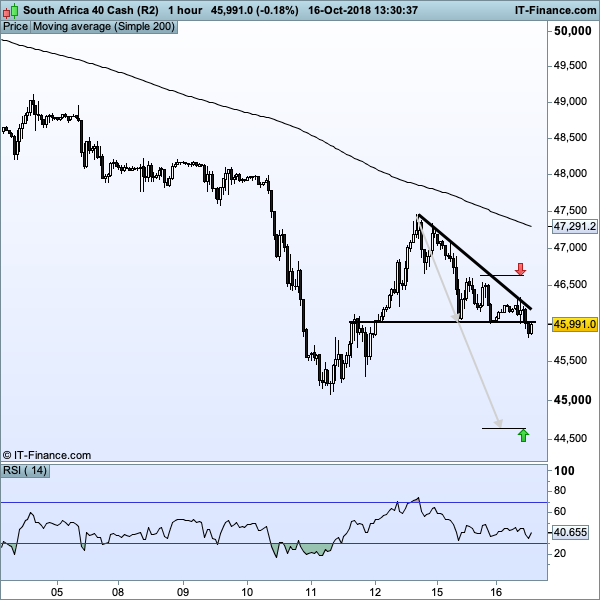
JSE daily Blood on the streets, indexes back to falling. South African version image Long way to go down if it doesn't stop falling
Mr. Scott's Crayon Thread
- JimmyC replied Oct 18, 2018
$AAPL Any Apple investors.... trade under cautionary image
Mr. Scott's Crayon Thread

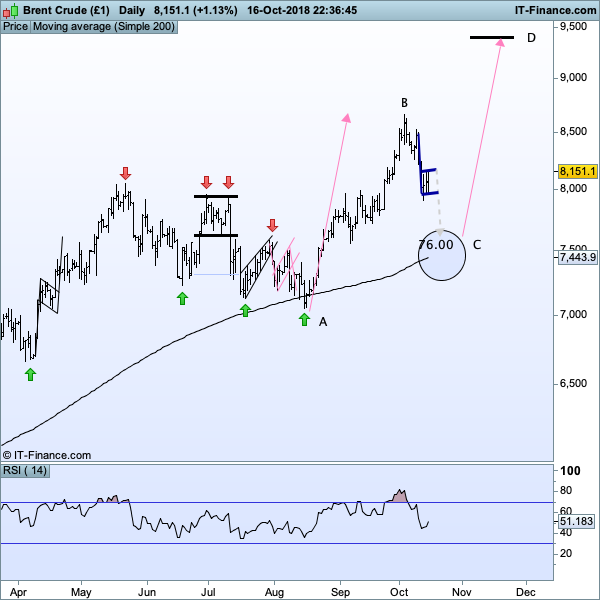
- JimmyC replied Oct 16, 2018
I have a thought around Brent Crude There is a scenario where it is building a bear flag which aims in and around the 200 day sma. This rebounds and continues towards the retracement target of 94.00 This is the roadmap... image Lets see
Mr. Scott's Crayon Thread
- JimmyC replied Oct 16, 2018
$LSE:JSE Top 40 (Cash index) 1 Hour view, at entry Given how heavily weighted the index can be to the currency, a common counterintuitive trade is to short the index when the currency strengthens. Fundamentals are aligned with this and the rest of ...
Mr. Scott's Crayon Thread
- JimmyC replied Oct 15, 2018
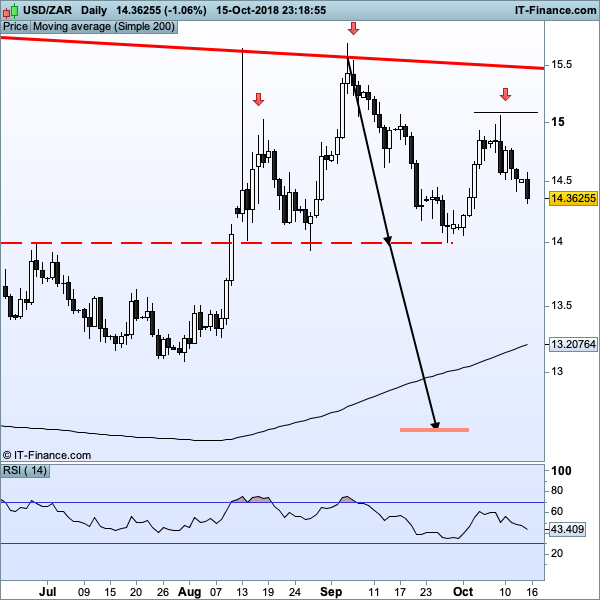
USDZAR Daily (Exotic & EM) A pattern in formation, classic H&S. As the pattern is incomplete, this is a watch-list item. Stop / Entry and Exit noted on the chart. image G/L
Mr. Scott's Crayon Thread
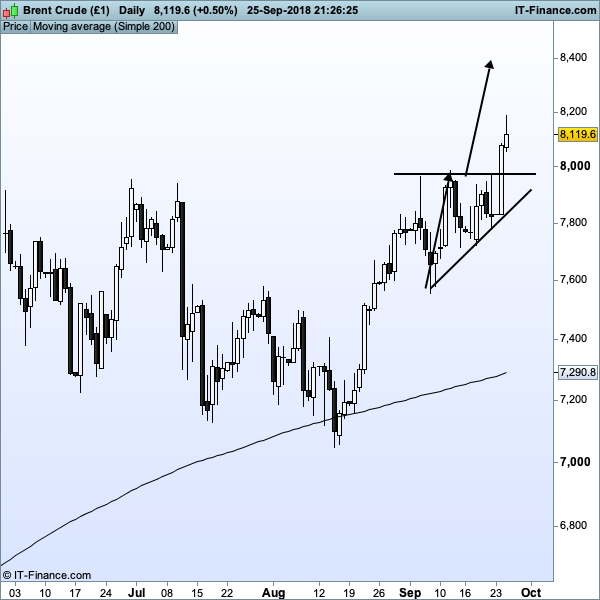
- JimmyC replied Sep 25, 2018
Note that the consolidation pattern more recent to the pattern that has formed during the month would suggest that targets should be revised in the medium term to $84.00 (Brent crude) at least. As such staying open. Fundamentals point to issues with ...
Mr. Scott's Crayon Thread