- Search Forex Factory
- 15 Results
-
 JFX81 replied Feb 27, 2008
Maybe, maybe not. I went long 30 minutes ago at 210.95 based off of the trend I drew in below, yet closed out at 211.14 because it is still dicey.
Lets Talk GBP/JPY "the geppy"
- JFX81 replied Nov 27, 2007
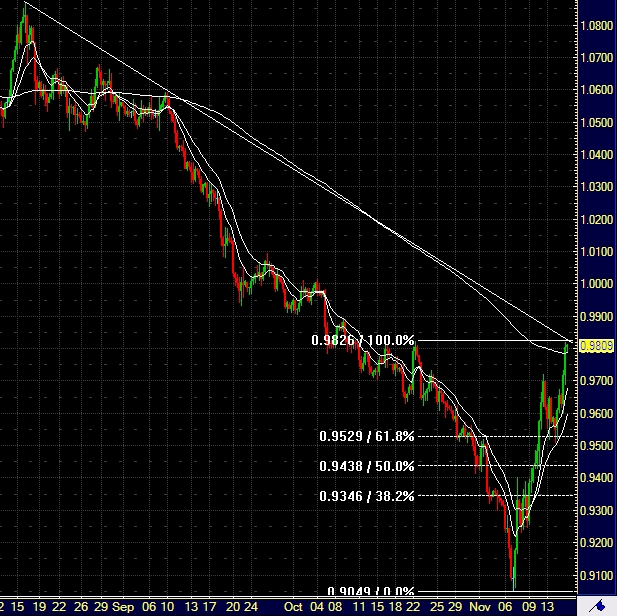
Never mind mods, I'll repost it as close as I can remember. Basically I said that the type of movements I was looking for came about 24 hours after the last post with charts and that this morning the price first stalled at the 38.2% retracement, ...
JFX Workshop (all strategies welcomed)
- JFX81 replied Nov 25, 2007
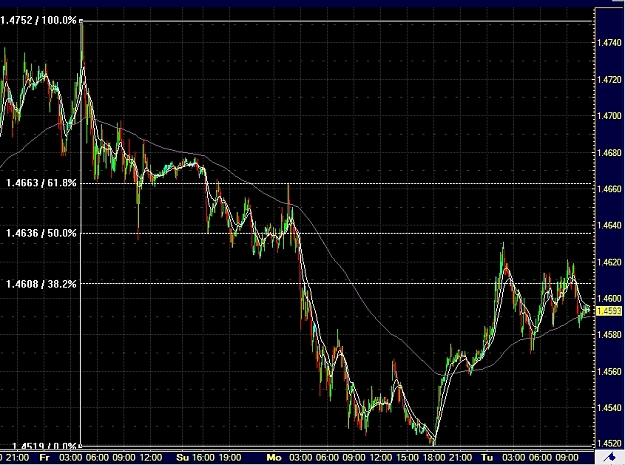
EUR/USD A few price points to consider when seeing if EUR/USD tests 1.5000 before Tuesday's Consumer Confidence and Wednesday's Existing Home Sales figures are released. The uptrend channel on the 4hr was indeed broken to the upside a slight bit on ...
JFX Workshop (all strategies welcomed)
- JFX81 replied Nov 15, 2007
Now let's look at the Canadian Dollar 4-hr chart. The USD has finally pushed back against the seemingly unstoppable Canadian currency. Philadelphia Fed figures came out earlier and were actually quite good. So now we see USD/CAD testing both the ...
JFX Workshop (all strategies welcomed)
- JFX81 replied Nov 13, 2007
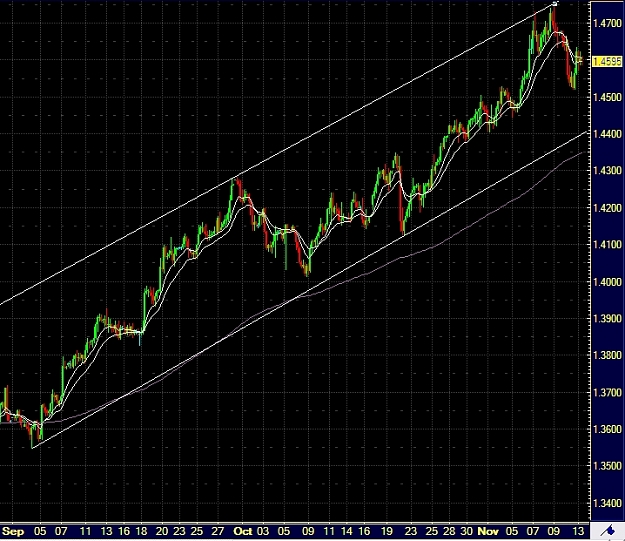
Tomorrow is the first real inflationary data of the week for the United States. Let's look at EUR/USD By looking at the 4hr chart that begins in Sept. one can see the sharp increase in value for the Euro and that it has been in a decent channel. ...
JFX Workshop (all strategies welcomed)
- JFX81 replied Oct 23, 2007
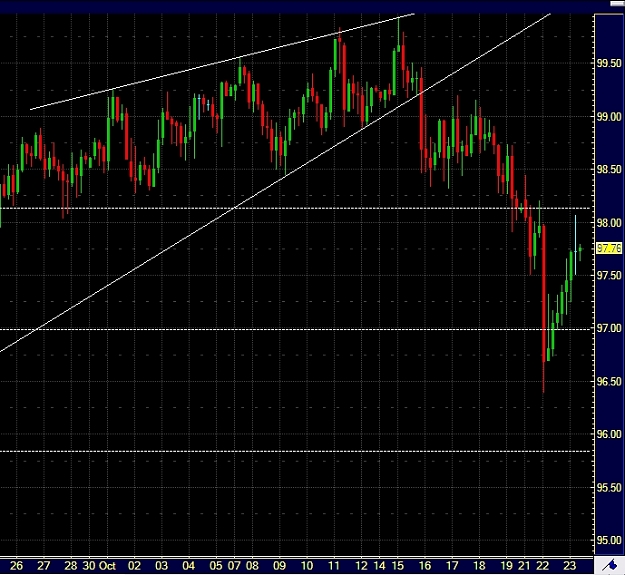
Time to revisit that chart. The trend flipped pretty decisively and if it stays below the 98.20 level then look for the trend to continue downward. Soul, did you catch that trend?
JFX Workshop (all strategies welcomed)
- JFX81 replied Oct 17, 2007
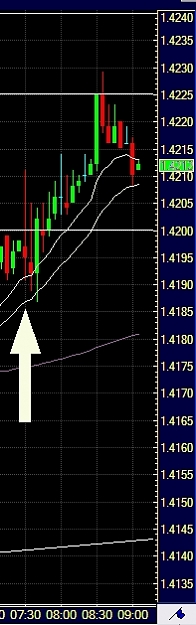
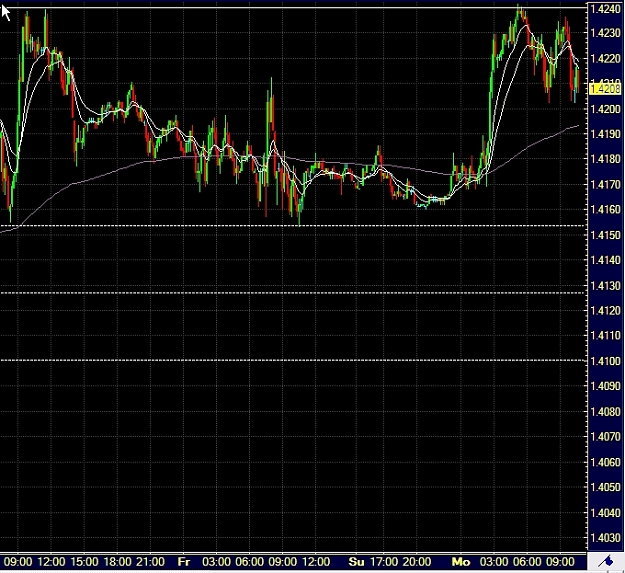
Core CPI came in right at consensus, stalled for a few minutes going up and down between 15 pips, and has just now touched 1.4225 The white arrow shows when the numbers came out and how things went down on the 5min chart.
JFX Workshop (all strategies welcomed)
- JFX81 replied Oct 17, 2007
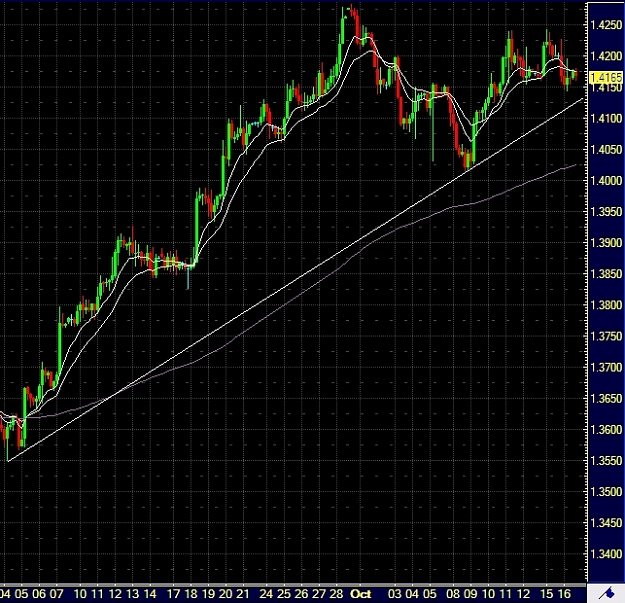
EUR/USD First I would like to start with giving a little look into the 4hr chart and see what is going on. Drawing in the major upward trendline yields the first obvious point of support at approximately 1.4138 If CPI comes in a hair strong then you ...
JFX Workshop (all strategies welcomed)
- JFX81 replied Oct 16, 2007
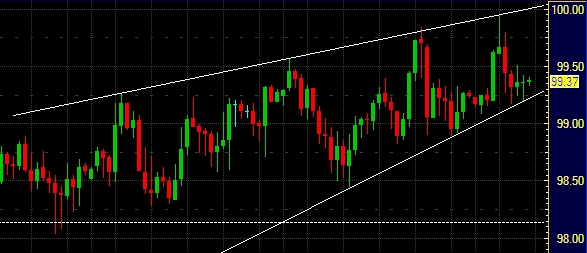
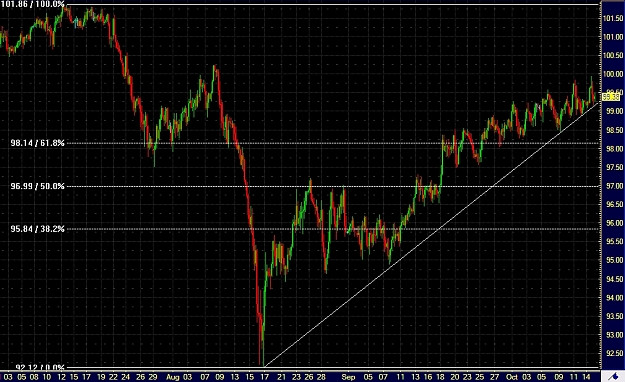
Going back to the CHF/JPY 4hour chart you can see it zoomed in and why I would want to take some profits near 99.95 should the price move that direction. It is very close the top of a small channel AND the 100.00 psychological number. I would also ...
JFX Workshop (all strategies welcomed)
- JFX81 replied Oct 15, 2007
While I await clarification I will break down the charts in a way that I do quite commonly. First let's look at the 4-hr chart. As you can see, the trendline drawn in is not perfect...but it is pretty solid. Next you can see the really broad ...
JFX Workshop (all strategies welcomed)
- JFX81 replied Oct 15, 2007
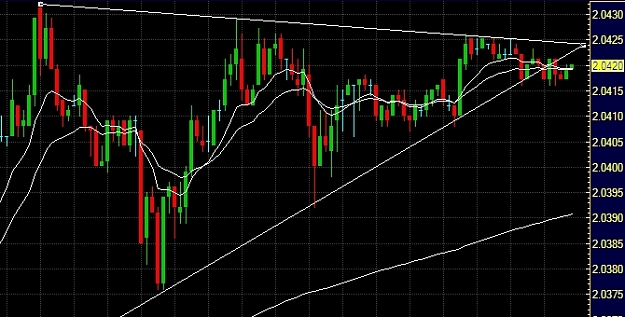
It gets better, because now we can see that this triangle pattern is over and it died out just as volatility died out over time. Perfect pattern and if anyone thinks it is just luck that it turned out that way must be crazy. It doesn't matter why ...
JFX Workshop (all strategies welcomed)
- JFX81 replied Oct 15, 2007
And we have yet another bounce off of that trend line. Things that make you go hmmm.
JFX Workshop (all strategies welcomed)
- JFX81 replied Oct 15, 2007
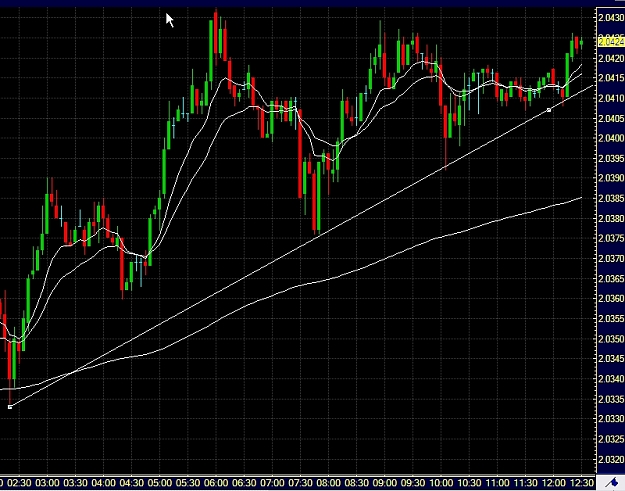
Another thing to notice this morning but this time from GBPUSD. You can see by drawing in something as simple as a trend line on the 5min it would show a nice point of support at 2.0393. As one can see the price did in fact dip one pip below that ...
JFX Workshop (all strategies welcomed)
- JFX81 replied Oct 15, 2007
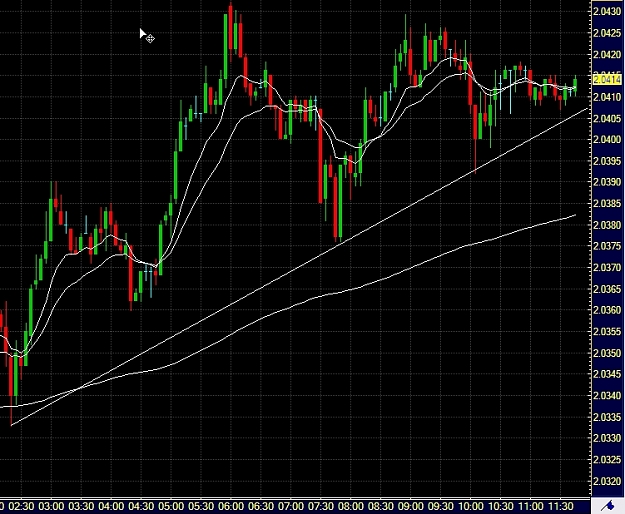
Remember those Fibonacci Lines we drew into the 10m chart on the previous thread? Those still come in handy at the moment. As you can see the price movement this morning halted, almost to the pip, at the top of those lines. If you had not drawn in ...
JFX Workshop (all strategies welcomed)
- JFX81 replied Oct 13, 2007
Well, I couldn't disagree more about price patterns on the 5min (or 10min for that matter). If anything, price patterns hold more value in the short term than longer term. Watching a 1min chart after a major news release where the market moves back ...
Soultrader's Clinic :)
- Posts by Member Search: 'JFX81'