- Search Forex Factory
- 68 Results
-
 GreatNorth replied Feb 13, 2015
December 30, 1964 was the START of the Benchmark and it was 2.505 October 28, 1976 was the Swing of the Benchmark at 1.2745 Charts Below.
Using WM/Reuters Benchmark Rates in trading
- GreatNorth replied Feb 13, 2015
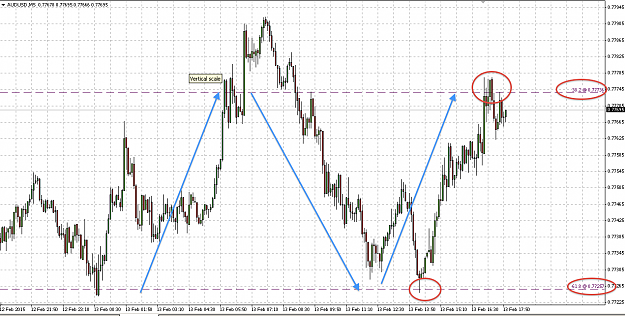
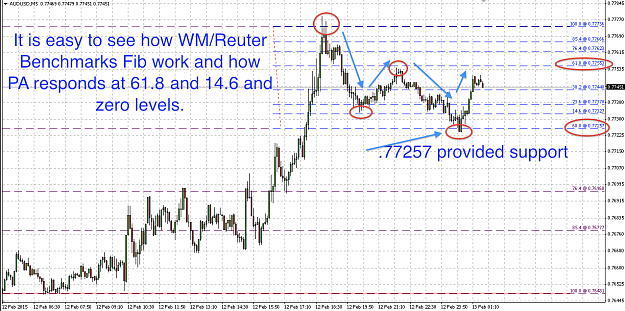
Update on the AUDUSD 5M Chart We can see how using the WM/Reuters Benchmarks on fibs that price moves between 38.2 and 61.8 Fibonacci Rates.
Using WM/Reuters Benchmark Rates in trading
- GreatNorth replied Feb 13, 2015
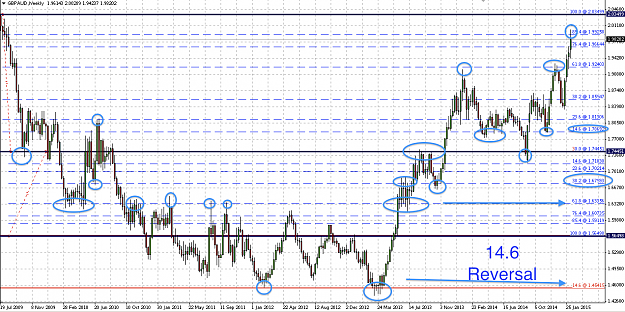
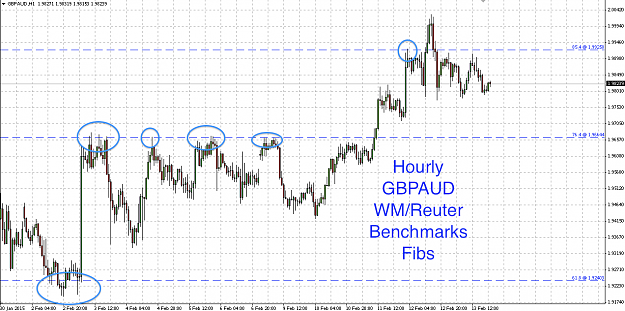
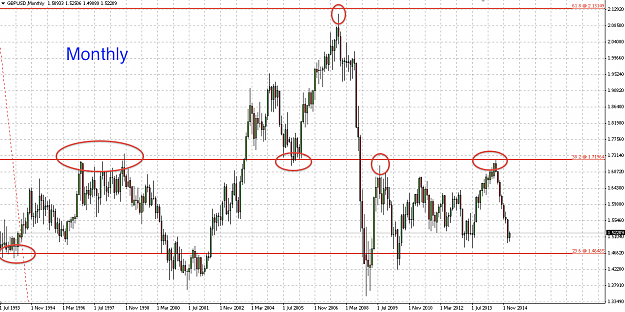
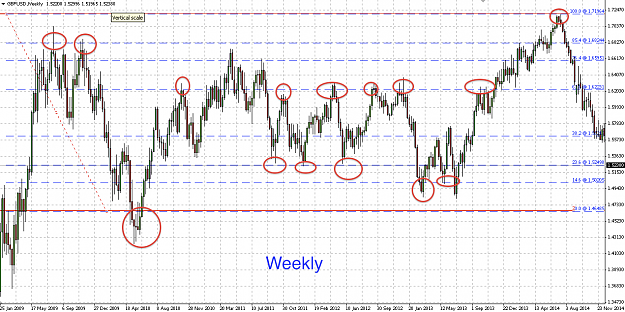
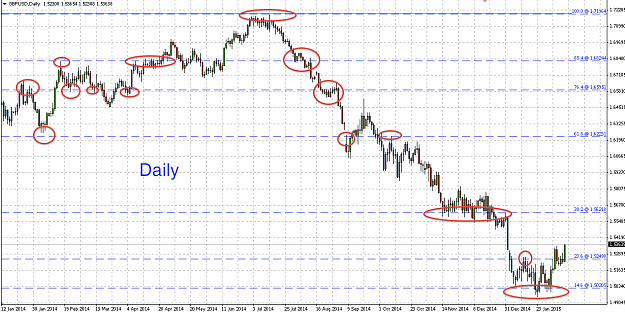
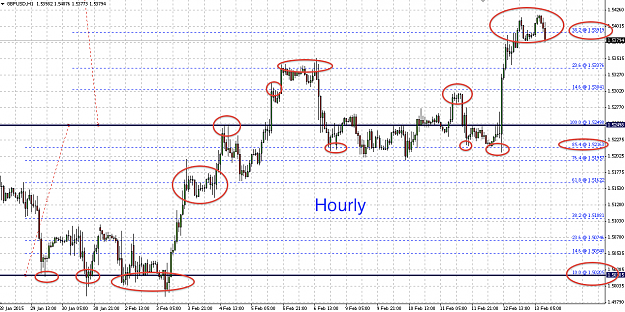
Charts for GBPUSD: Monthy Weekly Daily Hourly
Using WM/Reuters Benchmark Rates in trading
- GreatNorth replied Feb 13, 2015
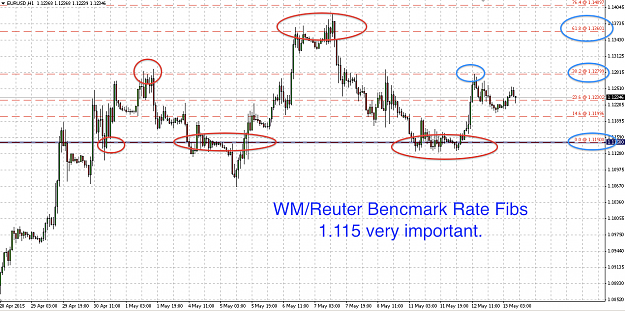
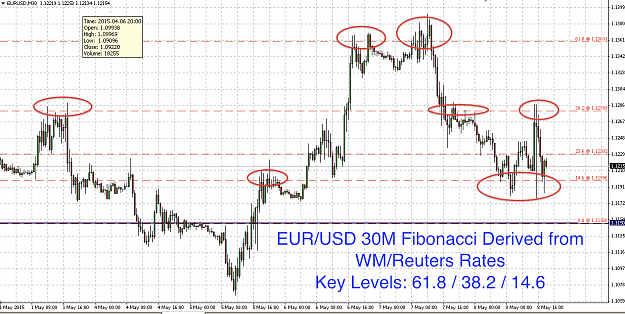
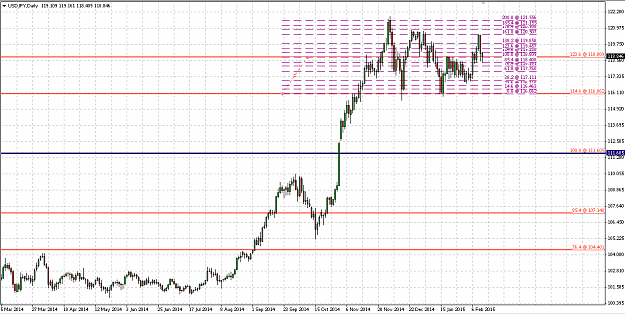
I'm including the larger chart. So you can see where the levels came from.
Using WM/Reuters Benchmark Rates in trading
- GreatNorth replied Feb 13, 2015
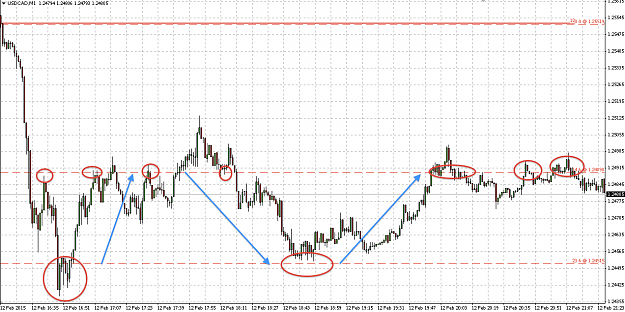
USDCAD Update with WM/R Benchmarks as Fibs.
Using WM/Reuters Benchmark Rates in trading
- GreatNorth replied Feb 13, 2015
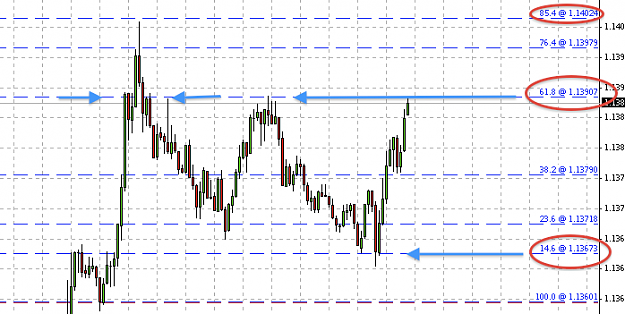
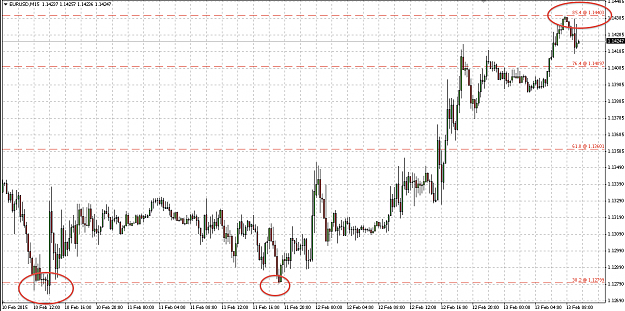
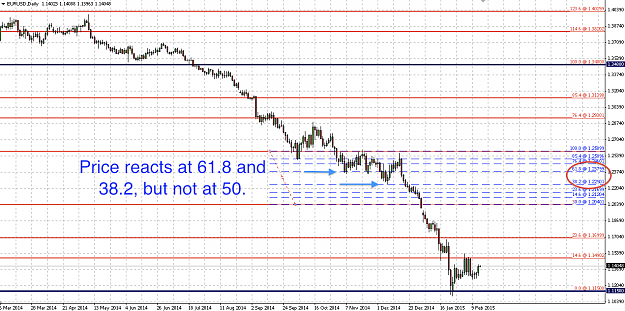
EURUSD 15M Chart. We can see that tonight's move has topped at 85.4 to the pip and is retracing. Easy. WM/Reuter Benchmarks as Fibs clearly show that 85.4% levels and 38.2/61.8 levels are strong levels that price reacts at.
Using WM/Reuters Benchmark Rates in trading
- GreatNorth replied Feb 12, 2015
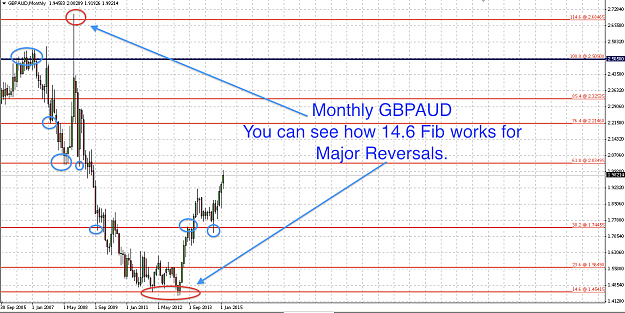
Updated chart. Price is consolidating at 14.6% level!
Using WM/Reuters Benchmark Rates in trading
- GreatNorth replied Feb 12, 2015
Update on the 1 Minute chart for the recent upmove in the last 20 minutes. Price moved straight up to the 85.4 level right to the pip and retraced!! It's now paused at 61.8. WM/Reuter Benchmarks are clearly used for trading as you can see with the ...
Using WM/Reuters Benchmark Rates in trading
- GreatNorth replied Feb 12, 2015
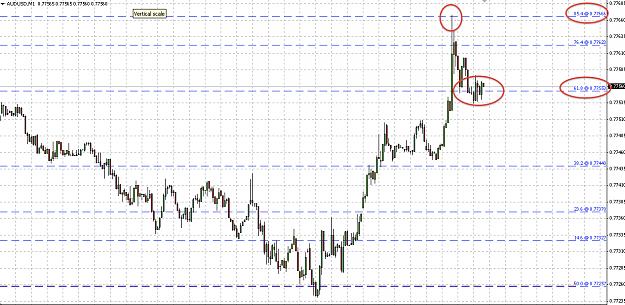
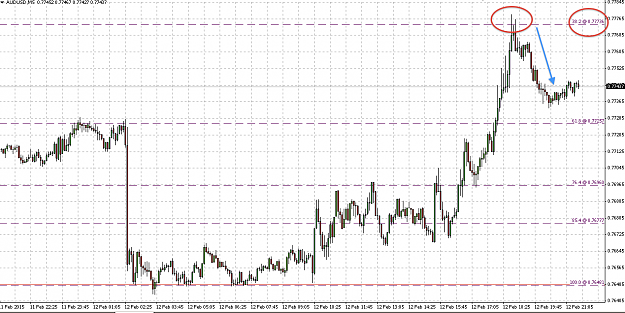
This is a 5M chart. From my WM/Reuter Benchmark Fibs. Without the WM/Reuters Benchmarks as Fibs you would be trading blind and not know that .77257 is a strong R and as you can see Price has touched that level and gone up +25 or so pips. There is ...
AUD/USD
- GreatNorth replied Feb 12, 2015
Update on the AUDUSD Chart This is a 5M chart. Without the WM/Reuters Benchmarks as Fibs you would be trading blind and not know that .77257 is a strong R and as you can see Price has touched that level and gone up +25 or so pips. This is when the ...
Using WM/Reuters Benchmark Rates in trading

- GreatNorth replied Feb 12, 2015
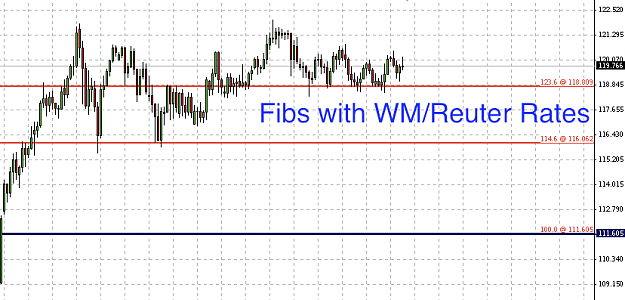
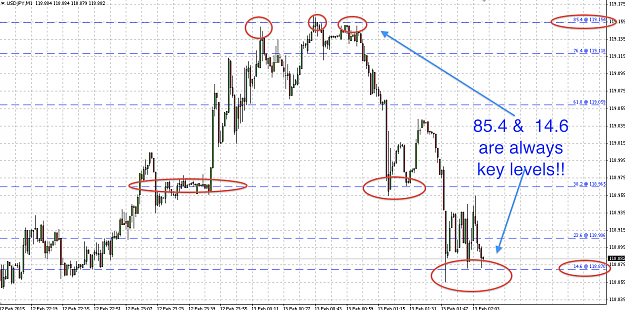
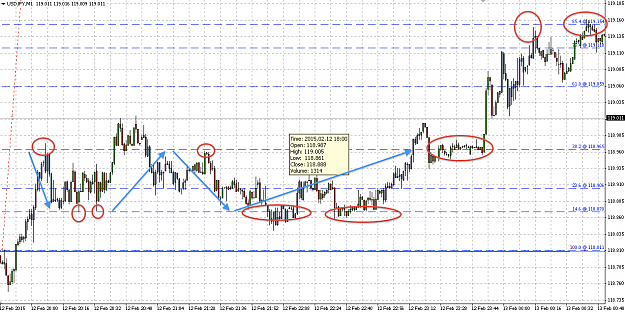
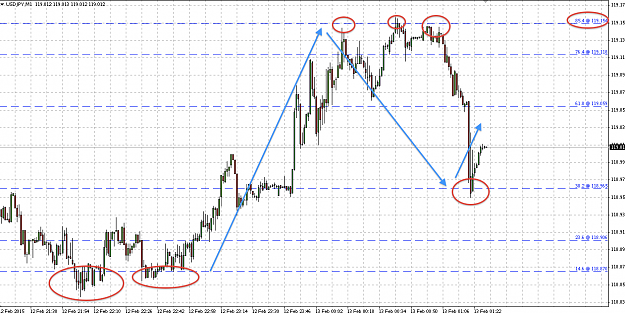
Update on USDJPY 1Minute Chart You can see how the both charts shows 38.2 acting as resistance, then it finds support at 14.6 and them moves all the way up to 85.4 before retracing back down to 38.2 where it bounced and where we are.
Using WM/Reuters Benchmark Rates in trading
- GreatNorth replied Feb 12, 2015
Hi, I'm glad this is helping fill in part of the puzzle. As for the calculations I calculate the levels as per the method below, which allows for the 76.4 and 14.6 levels. 61.8 is derived by dividing any number in the sequence by the number that ...
Using WM/Reuters Benchmark Rates in trading
- GreatNorth replied Feb 12, 2015
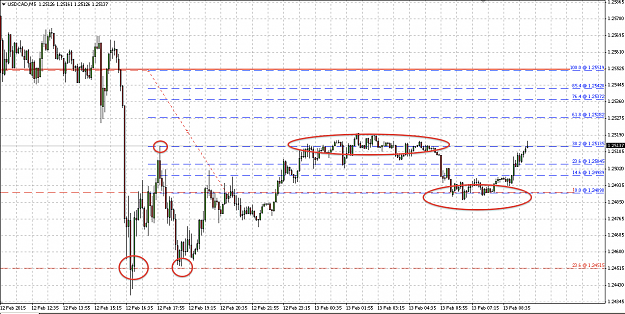
Here is USDCAD. You can see at the one minute level how it respects the 14.6 fib at 1.24898. It's has been in the 23.6/14.6 range since the move this morning.
Using WM/Reuters Benchmark Rates in trading
- GreatNorth replied Feb 12, 2015
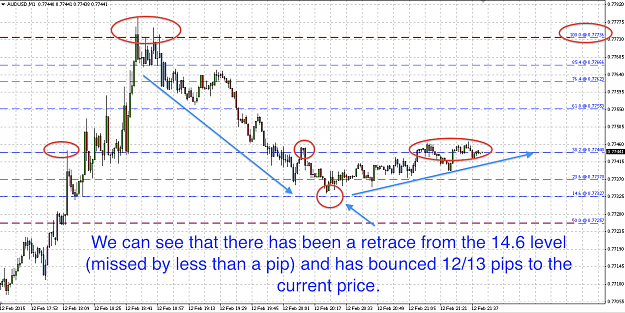
Update on the AUDUSD 5M chart and 1M Chart from this morning. Without these levels you would not know that there is 38.2% Fib at .77736. The days price hit that level, overshot by 4 or 5 pips and is retracing on the 14.6 Level. Easy!
Using WM/Reuters Benchmark Rates in trading
- GreatNorth replied Feb 12, 2015
Update on the 1Minute Chart (I'm using 1Minute so you can see that all the bounces today have occurred at 85.4/14.6 and 38.2/68.1 From this chart after hitting the 1.14097 Fib this morning it retraced exactly down to the 61.8 and rebounded. This is ...
Using WM/Reuters Benchmark Rates in trading
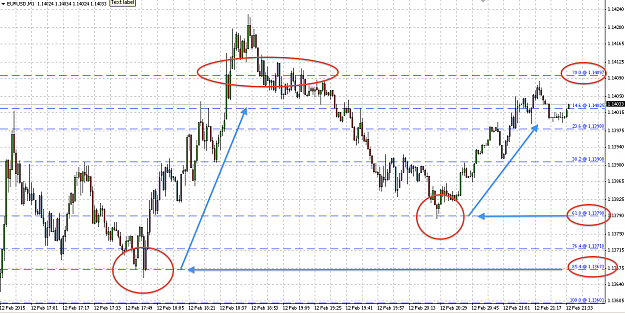
- GreatNorth replied Feb 12, 2015
One Minute EURUSD Chart using Wm/R Benchmark rates on fibs. 85.4/14.6 provide good reversal opportunities on all time frames. The days top was 85.4 and then we retraced to 14.6.
EURUSD

- GreatNorth replied Feb 12, 2015
Update on the EURUSD 1M chart. These levels, again come from WM/R Benchmarks from before 1996. You can see how we topped at 85.4 and then bounced from 14.6 These levels usually provide reversals. At all chart time frames.
Using WM/Reuters Benchmark Rates in trading