- Search Forex Factory
- 28 Results
-
 FXFundi replied Aug 6, 2013
Could this be the right shoulder of a head and shoulders formation. I'm short - targeting 1.3200, with SL at 1.3323.
EURUSD
- FXFundi replied Jan 18, 2012
A picture is worth a thousand words — I'm short from 1.2836 - TP 1.2725 and SL will be 1.2900 - good luck all.
EURUSD
- FXFundi replied Jan 13, 2012
Agree with MaxD. Approaching top of the daily downward channel (Trend is still down) - I'll take a short for a 80 pip retrace here at 1.2880. will only look for longs once she has clearly broken above the channel!
EURUSD
- FXFundi replied Sep 1, 2011
Bottom — I think we have reached image Hope I'm correct.
Cable Update (GBPUSD)

- FXFundi replied Aug 23, 2011
H&S — image Closed Long now looking to short the Head and Shoulder Formation. Will look for entry candle on lower time frame.
Cable Update (GBPUSD)
- FXFundi replied Apr 6, 2011
Head and Shoulders / Crown — A picture speaks a thousand words - this is what I'm seeing. Hope I'm right - I'm short, target is 1.6000 image
Cable Update (GBPUSD)
- FXFundi replied Jan 26, 2011
Thought I'd add a picture. ("A picture is worth a thousand words" Napoleon Bonaparte) image
Cable Update (GBPUSD)

- FXFundi replied Dec 10, 2010
Looks like the bulls are getting ready to mount an attack on the WALL at 1.5830. I'm going to image for now!
Cable Update (GBPUSD)

- FXFundi replied Jul 1, 2010
Crown / H & S — Crown / H&S formation mentioned a few days ago worked out. url This is what I'm seeing at the mo. A bigger Crown / H & S might be forming. image
Cable Update (GBPUSD)
- FXFundi replied Jun 14, 2010
image Past support = future resistance @ 1.4800 and Daily .50 Fib is at 1.4875. It's also approaching the top range of the upper channel. So If we get a shooting star or evening star in the "Sell Zone" I'll be shorting.
Cable Update (GBPUSD)
- FXFundi replied Jun 3, 2010
Thought I'd po$t a picture of what I'm $eeing. image
Cable Update (GBPUSD)
- FXFundi replied Jan 29, 2010
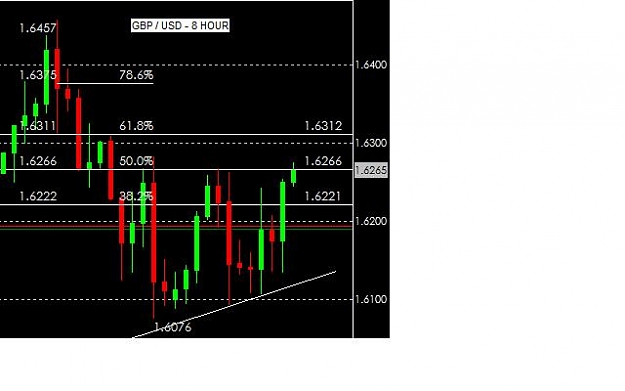
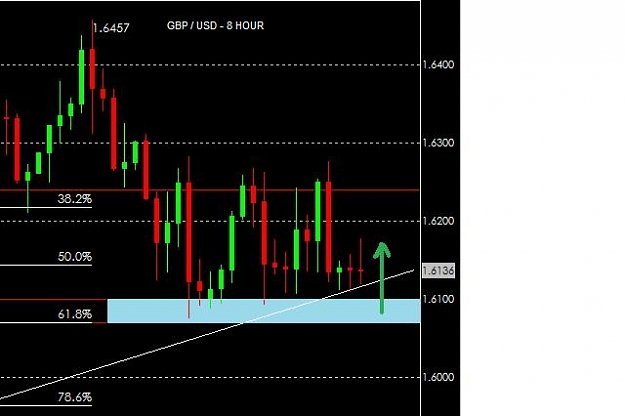
What time frame you looking at. This is my 8 hour with Fibs, the blue area is THE BUY ZONE - but only if I get a bullish Candle formation.
Cable Update (GBPUSD)
- FXFundi replied Jan 29, 2010
This is like fishing, got a few nibbles but waiting for the big one.
Cable Update (GBPUSD)
- FXFundi replied Jan 28, 2010
This is what I'm seeing - sorry I said 4 hour, in my previous post but it's clearer on my 8 hour.
Cable Update (GBPUSD)