- Search Forex Factory
- 55 Results

-
 Eynshteyn replied Mar 25, 2012
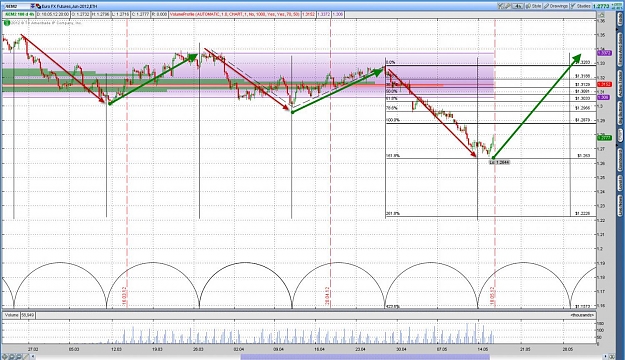
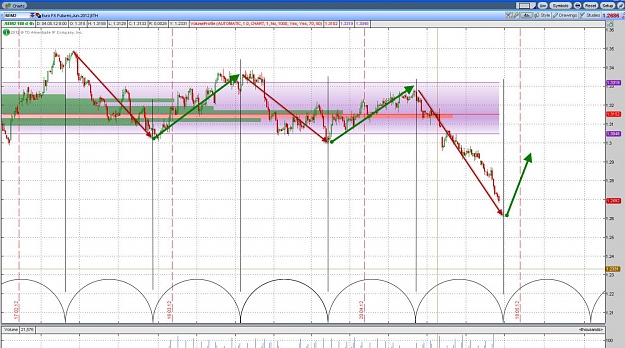
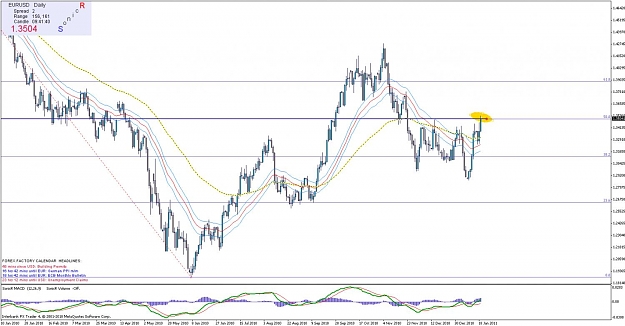
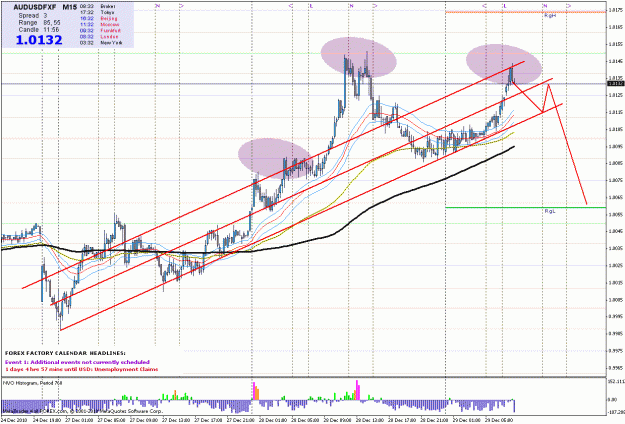
Hi all! — The figure shows the price chart, with three daily bars. As you can see, a clear signal for a turn, and the fall of prices in the area of 1.2783 image
EURUSD
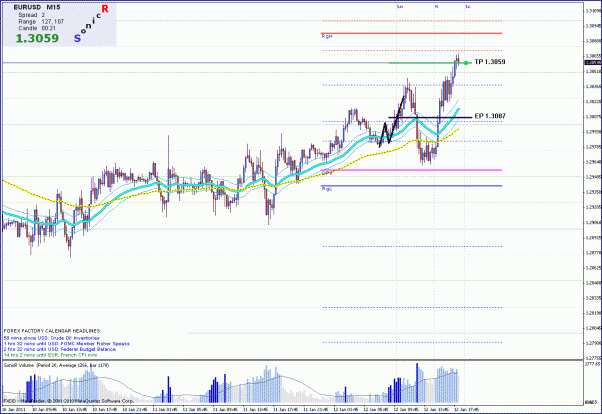
- Eynshteyn replied Jan 31, 2011
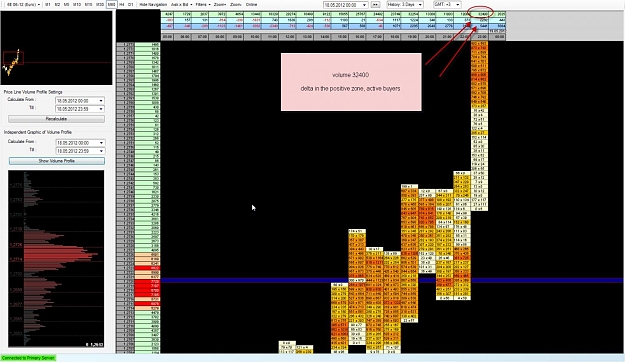
Hi — proceeding with the analysis we should all still go down to these objectives
Cable Update (GBPUSD)
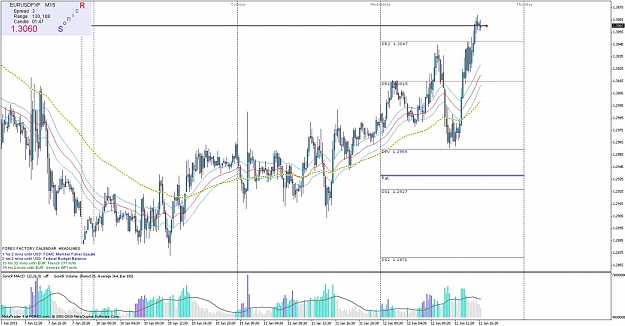
- Eynshteyn replied Dec 29, 2010
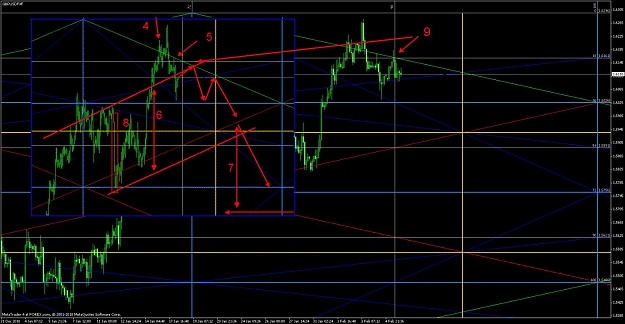
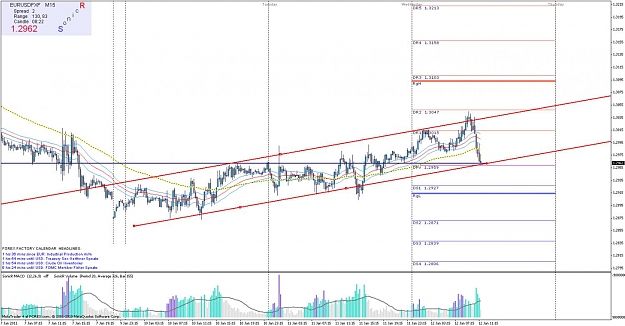
Sonic R. System head - shoulder, in the conclusion of the second arm .....
- Eynshteyn replied Dec 23, 2010
so what is there to say Let us see just what it once on the formation of two candles
Sonic R. System preparing the sleigh slides with slides
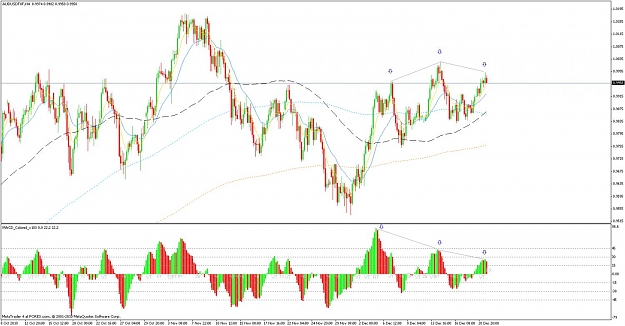
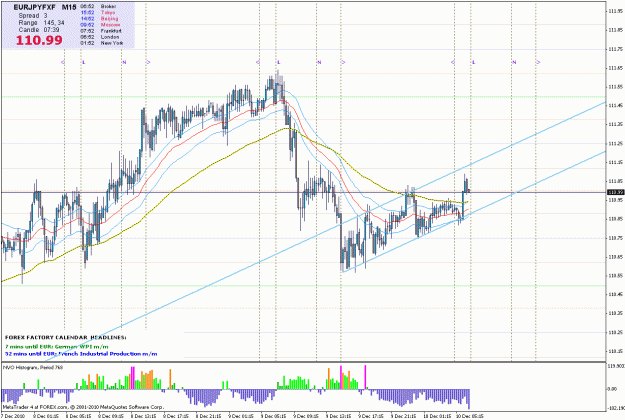
- Eynshteyn replied Dec 21, 2010
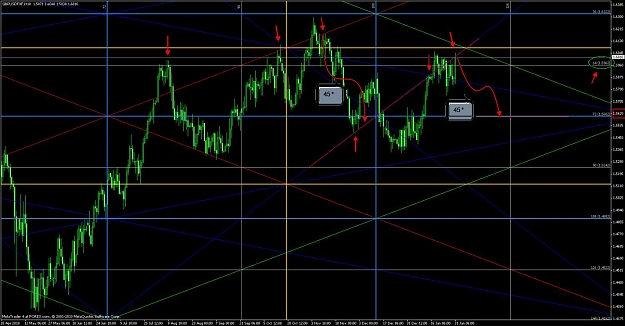
3rd divergence on the chart and the MACD, good signal
Sonic R. System
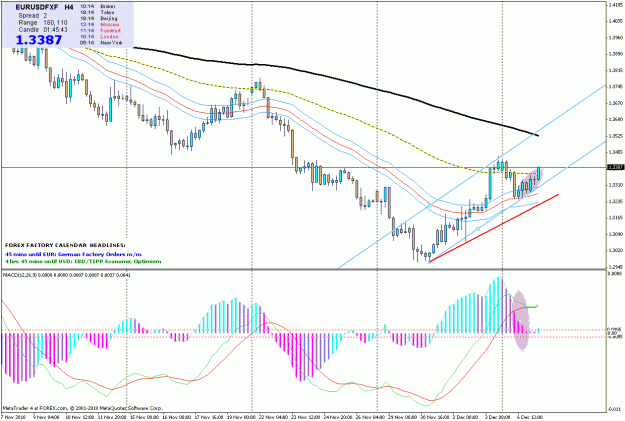
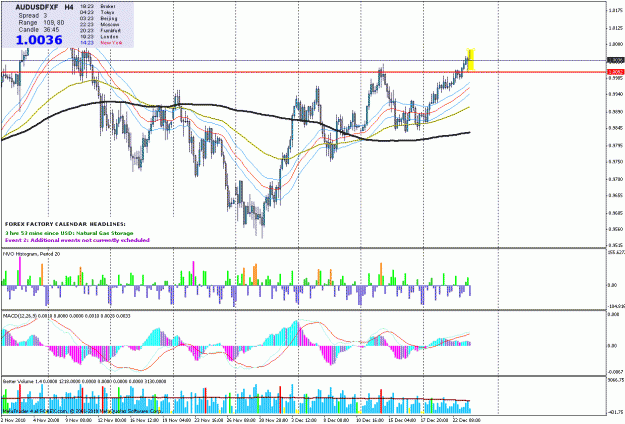
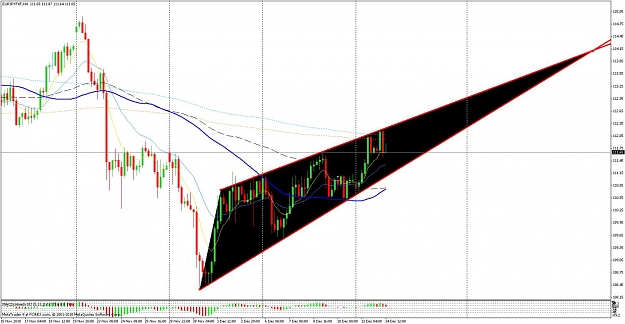
- Eynshteyn replied Dec 16, 2010
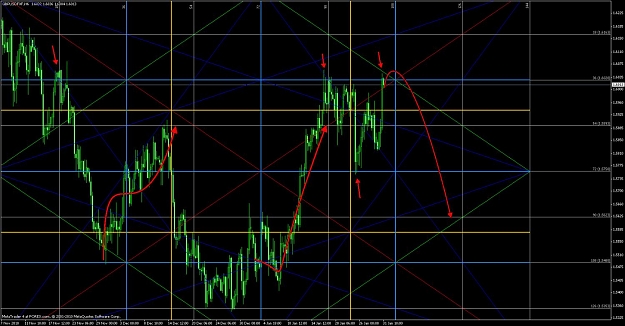
formation - a diamond, a good signal to continue the trend
Sonic R. System
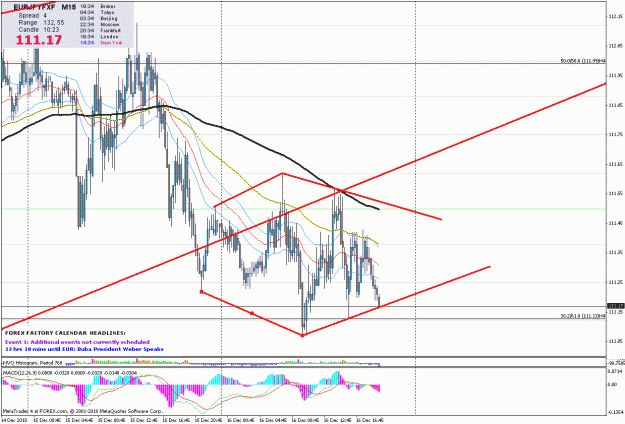
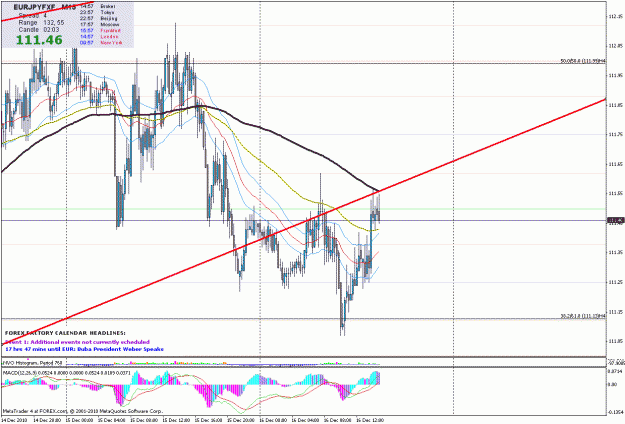
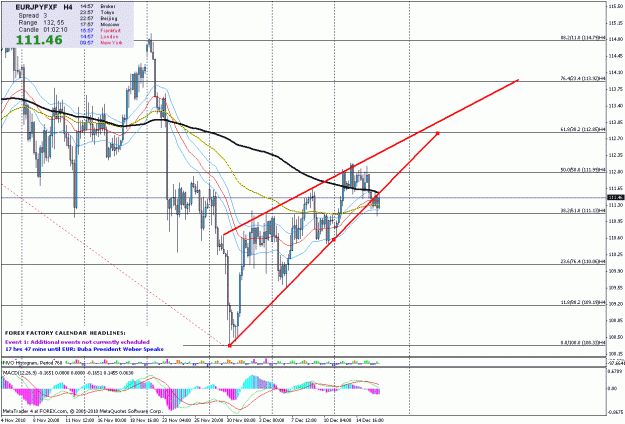
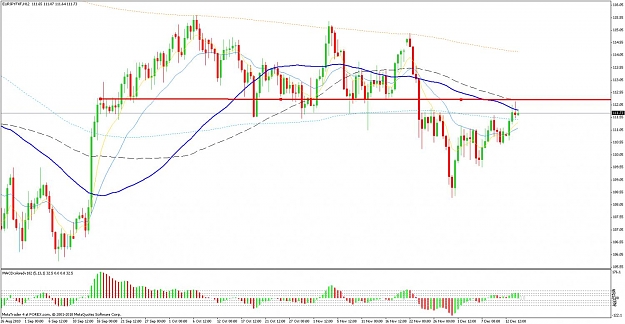
- Eynshteyn replied Dec 14, 2010
E/J ...... bearish
Sonic R. System triangle at 4 hours, and the rebound from 60 mA to 12 hours, what is waiting ..
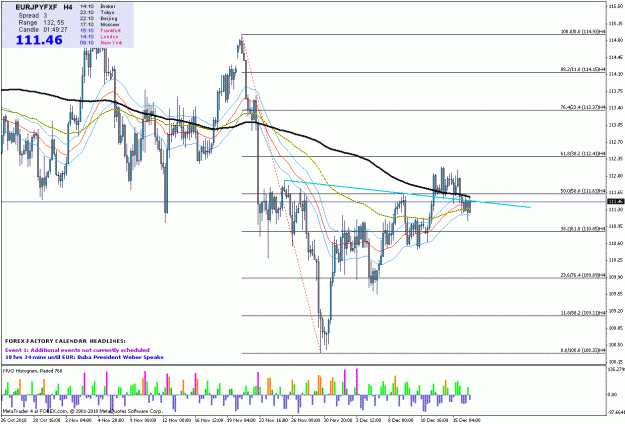
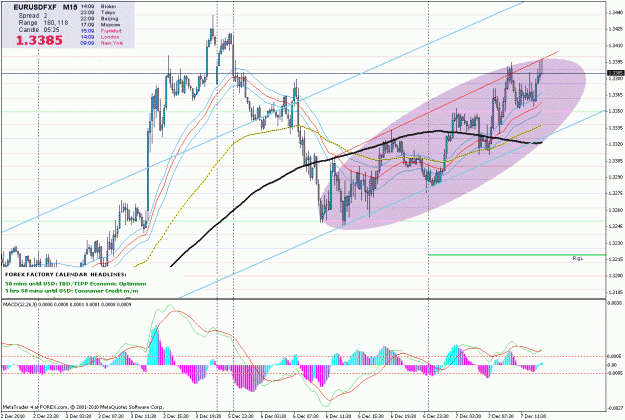
- Eynshteyn replied Dec 10, 2010
hello, well if I'm not mistaken it is easily visible bearish channel
Sonic R. System
- Eynshteyn replied Dec 7, 2010
MACD - falls, the schedule - is growing. Presumably a strong impetus down. Sorry for the English
Sonic R. System