- Search Forex Factory
- 19 Results
-
 DLTravel replied Dec 20, 2022
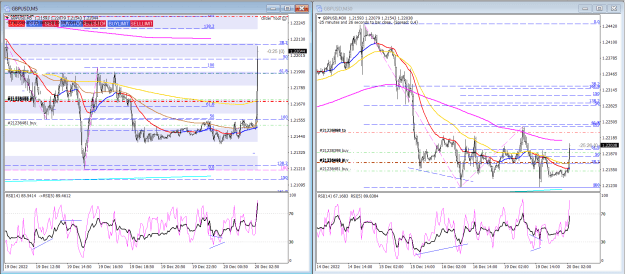
Today trade in Asian section, with new Alan's multi-entries style, 20 pips grid Winning about 1x80, 1x60 and 1x40 pips. Total ~ 180 pips image
Trading the Cable swings via averages
- DLTravel replied Dec 17, 2022
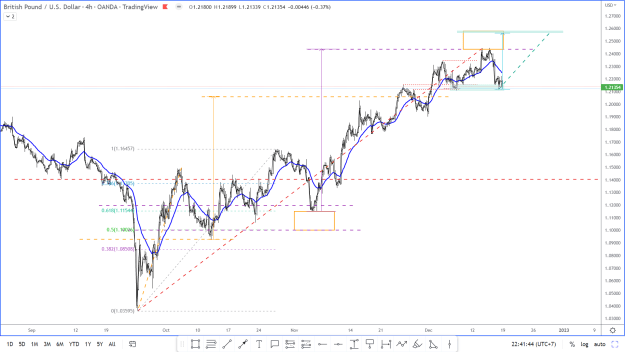
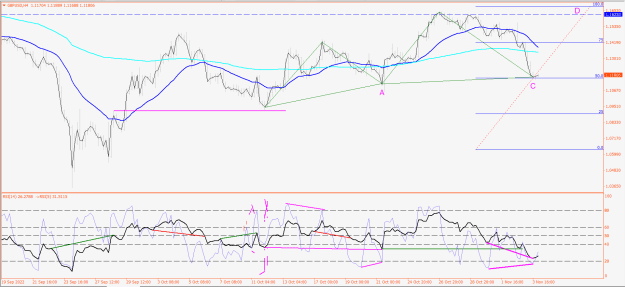
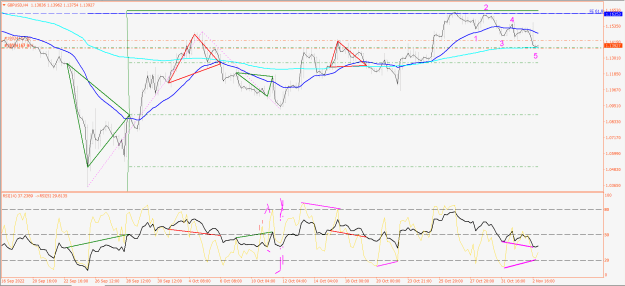
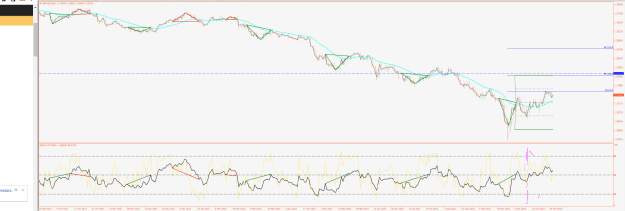
Sorry I've made a mistake in the above H4 chart. If my study is correct, GU should go like this: image
Trading the Cable swings via averages
- DLTravel replied Dec 17, 2022
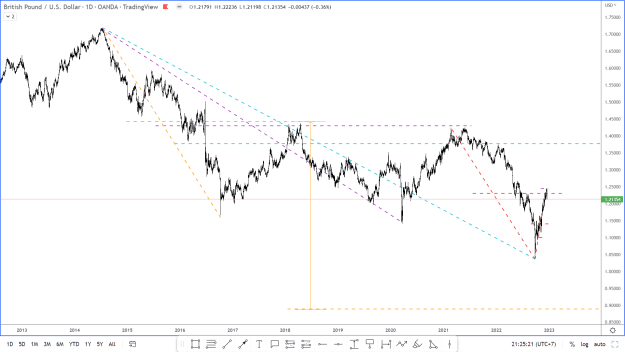
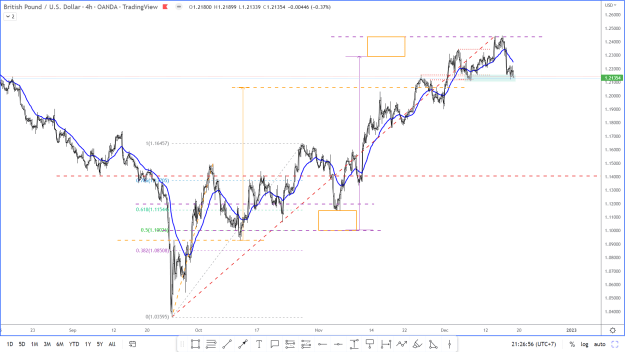
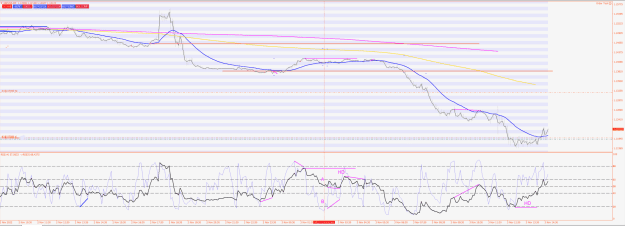
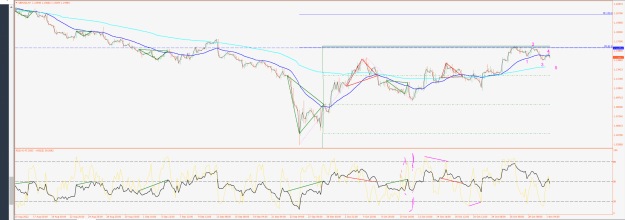
My study of measured move in Daily and H4 chart image image
Trading the Cable swings via averages
- DLTravel replied Nov 4, 2022
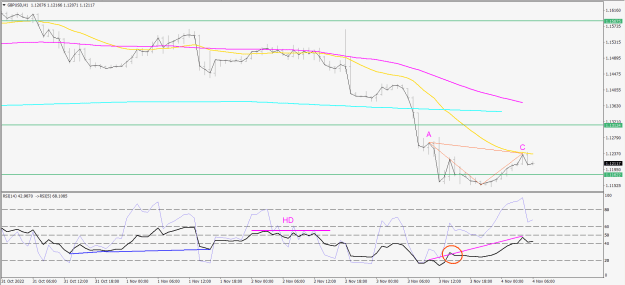
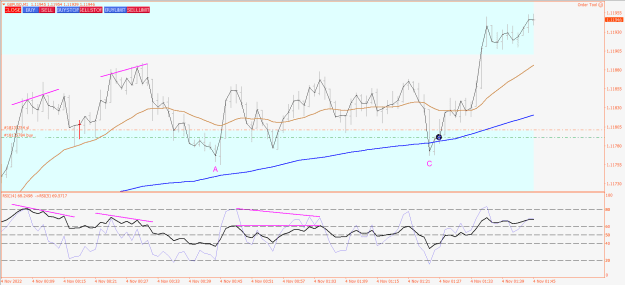
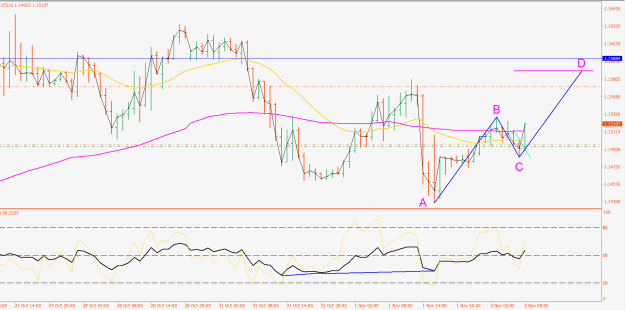
Dear Alan, I see an ABC Continuation Div on H1. Price at C tried to attack pivot A but failed. What I am hesitate is there is a touch in slow RSI between A and C (in the RED circle). Is it still valid? image
Trading the Cable swings via averages
- DLTravel replied Nov 4, 2022
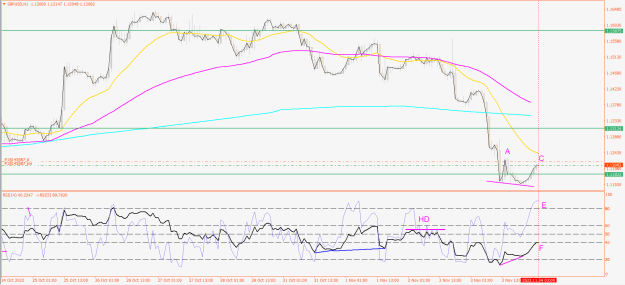
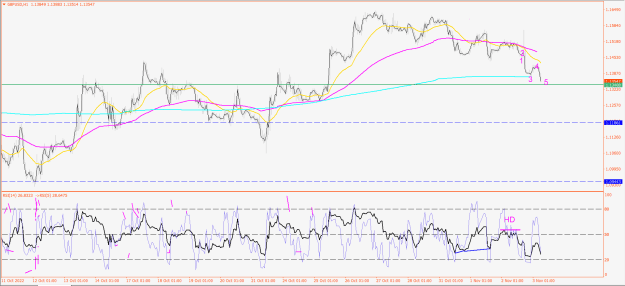
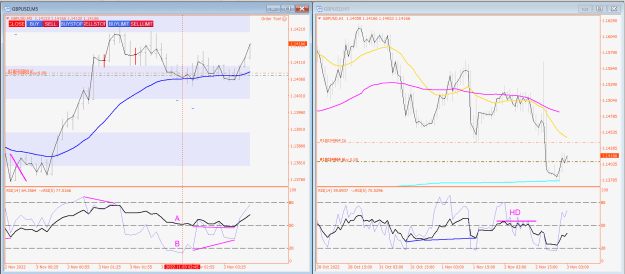
Same situation but now there is a weakness of the bulls on H1 Price at point C is trying to attack the pivot at point A. RSI made HH but price SEEMS cannot make a HH. And while the fast RSI heads up to overbought area, the slow is still staying ...
Trading the Cable swings via averages
- DLTravel replied Nov 3, 2022
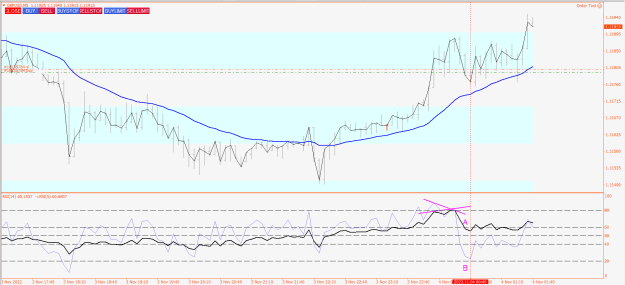
There is a Reg Bull Div on H1 thus I looked for a long opportunity on M5 image On M5 I saw a weakness sign of the bear. They tried to push price back down but couldn't across EMA. The fast RSI went down to oversold area but the slow still keep ...
Trading the Cable swings via averages
- DLTravel replied Nov 3, 2022
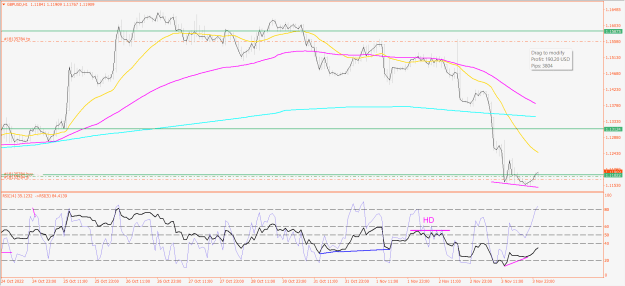
Thank you so much and well noted Alan. I was too excited on the pullback of H1. It seems on H1 it comes to a consolidation period. It plays pingpong on both sides of M5 EMA now. But in H4 I see an RSI bull div and an ABCD pattern. Thus I am ...
Trading the Cable swings via averages
- DLTravel replied Nov 3, 2022
I see a bull HD on M5 thus I go long with an expectation that it will come back to touch EMA H1. It also found support on M5 EMA image
Trading the Cable swings via averages
- DLTravel replied Nov 3, 2022
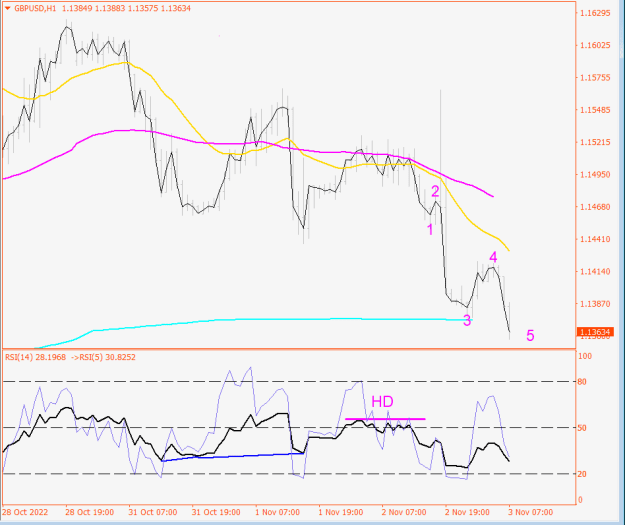
It is testing previous H1 EMA swing high. Will it fail here and make a bull div to end the wave 5? image
Trading the Cable swings via averages
- DLTravel replied Nov 3, 2022
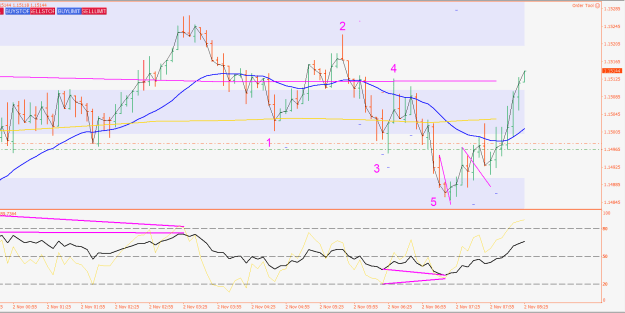
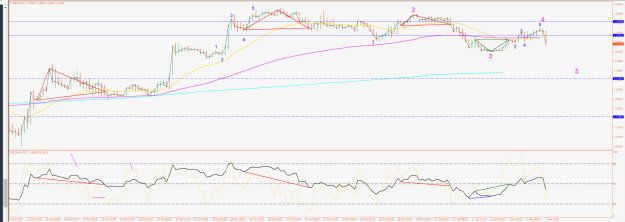
From wave count on H1 it seems we have a potential ZOO ahead image
Trading the Cable swings via averages
- DLTravel replied Nov 3, 2022
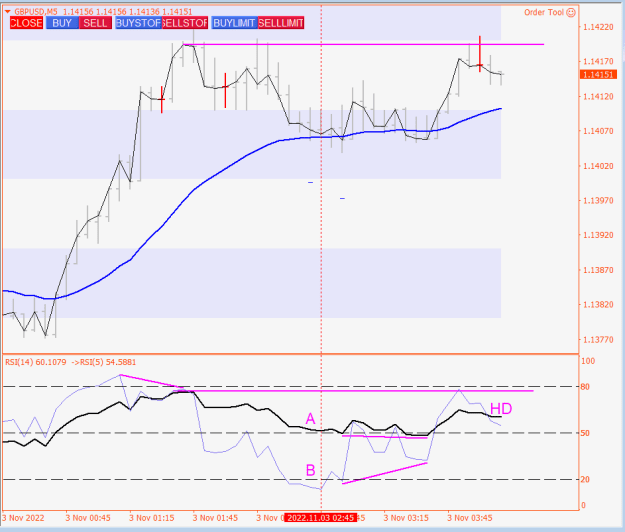
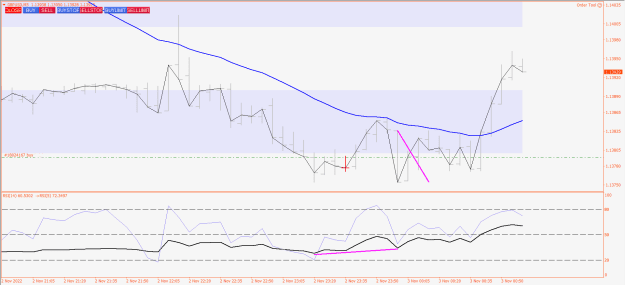
There is a bear HD on M5 so I closed my 2nd trade at about 10 pips profit. So I think total 50 pips profit is good enough if we consider that we are in Asian session. image
Trading the Cable swings via averages
- DLTravel replied Nov 3, 2022
My 2nd trade: On M5 chart I saw a weakness of the bear. A bear div sent price back to EMA but couldn't close below EMA, and then the slow RSI is still hang over the waterline (point A). In the same time, the fast RSI head down to oversold area ...
Trading the Cable swings via averages
- DLTravel replied Nov 2, 2022
I see an RSI Bull Div on H4. And wave 5 came to an end. It touched (or nearly) EMA D1 as well. Thus I am looking for long opportunity on M5. image On M5 chart we have a Reg Bull Div, a 2BT then I go long. image
Trading the Cable swings via averages
- DLTravel replied Nov 2, 2022
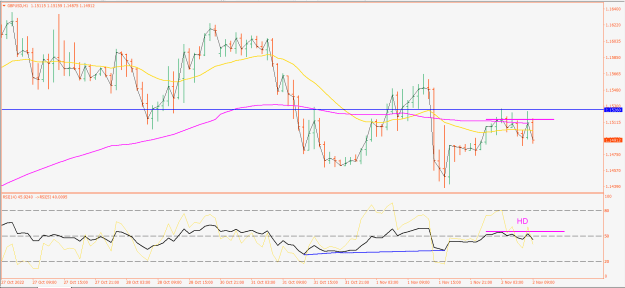
It seems we have a HD on H1 chart image
Trading the Cable swings via averages
- DLTravel replied Nov 2, 2022
A RSI Bull Div sent price back to EMA M5, made some 2BT and bull found support there. image I expect it to move and reach the target in an AB = CD on H1. There is another 2BT on H1 too. image
Trading the Cable swings via averages
- DLTravel replied Nov 1, 2022
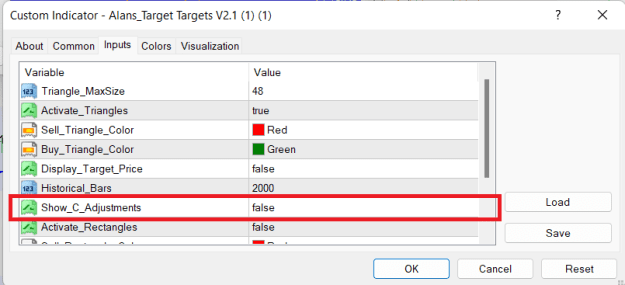
Hello You should set this to FALSE image Cheers,
Trading the Cable swings via averages
- DLTravel replied Nov 1, 2022
I am quite exciting with Master Alan's wave counting. Definitely I am not familiar with Alan's wave counting method, because he hasn't shared it yet (maybe he will do that someday).
Trading the Cable swings via averages I apply some EWP knowledge to try to explain the current ...
- DLTravel replied Nov 1, 2022
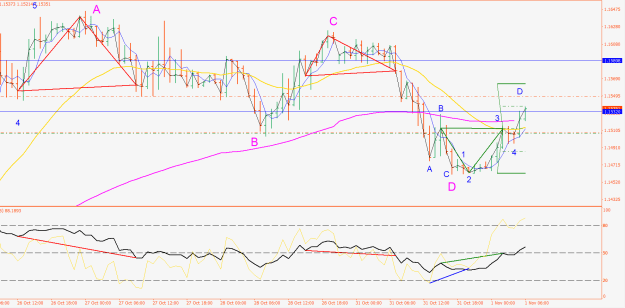
Yes, I see. I applied your wave count style on current GU H1 chart. Hope it is correct.
Trading the Cable swings via averages
- DLTravel replied Oct 31, 2022
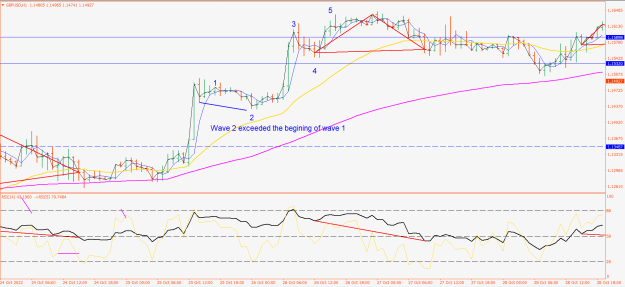
Thanks a lot for your clarification Alan. It looks more clear to me. Your waves counting is also very interesting too. It seems you are using Elliott Wave Principle, an't you? Althouh in some wave counts I saw wave 2 had a violation, it exceeded the ...
Trading the Cable swings via averages
- Posts by Member Search: 'DLTravel'