- Search Forex Factory
- 21 Results
-
 DKallDAY replied Nov 5, 2010
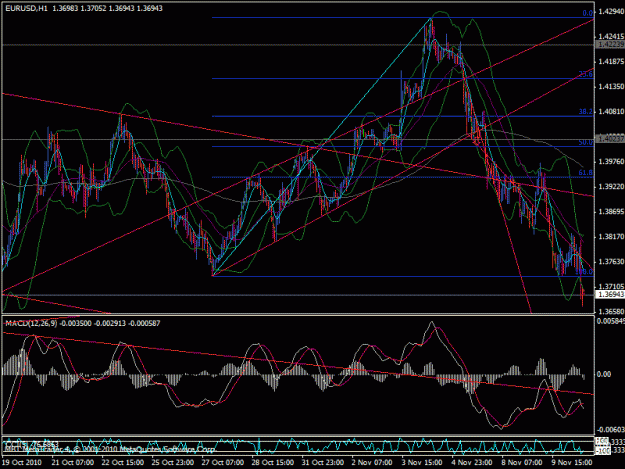
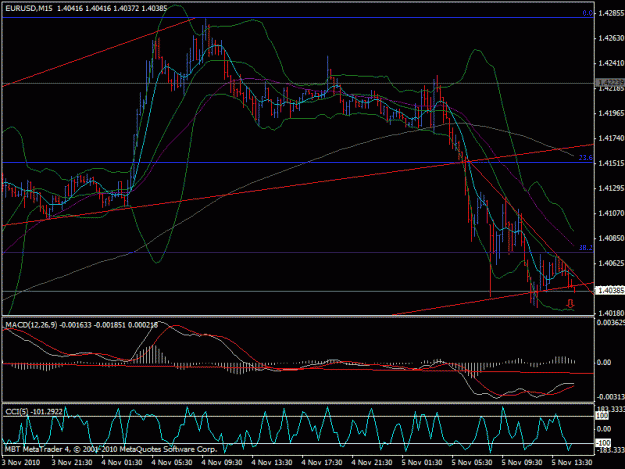
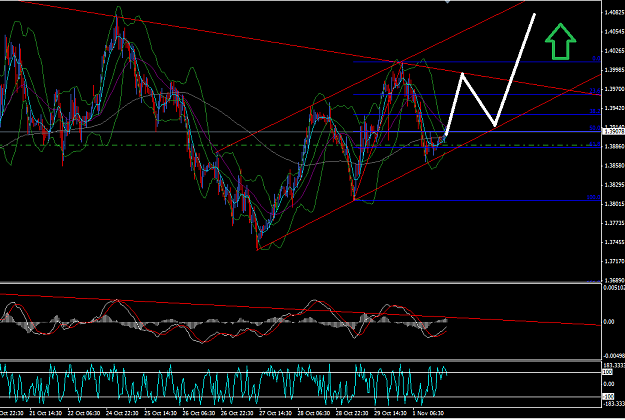
agreed. Descending wedge pattern. I think it's consolidating right now to break the lower trendline clean.
EURUSD
- DKallDAY replied Nov 5, 2010
straight money. Hope you all have been makin some good trades! Shorties got burned a couple days ago on the 2nd trendline bounce.
EURUSD
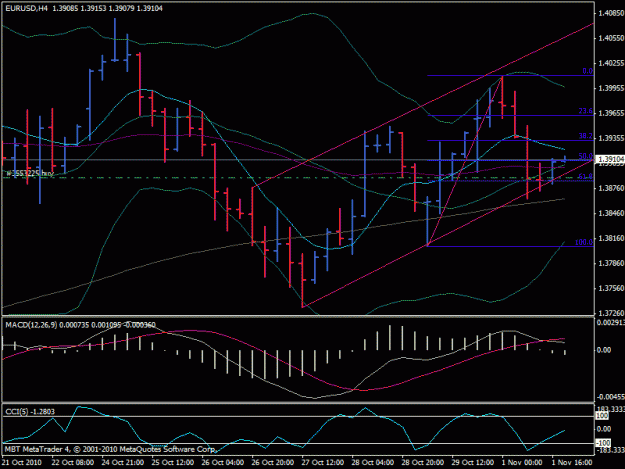
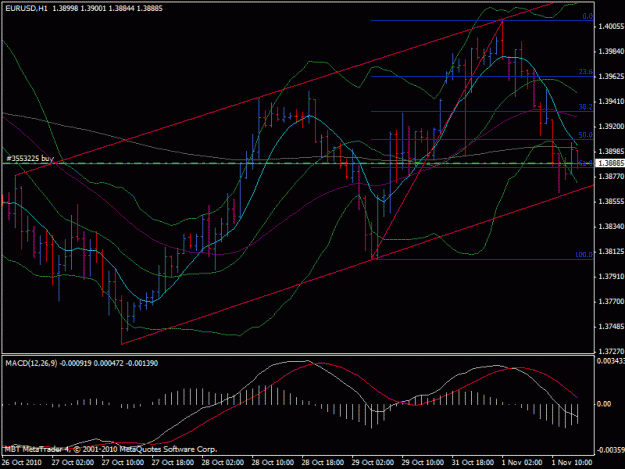
- DKallDAY replied Nov 2, 2010
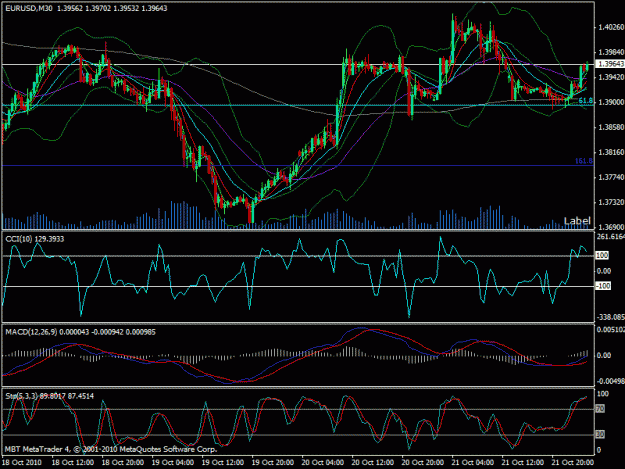
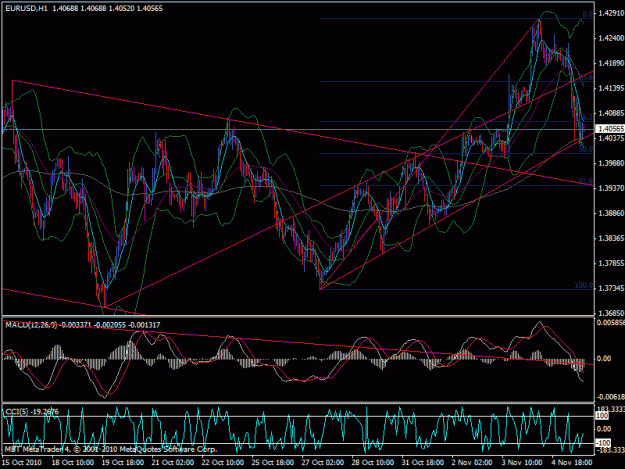
anyone else see that decending trendline on the MACD peaks for the 4 hour chart?
EURUSD
- DKallDAY replied Nov 2, 2010
could very well be a breakout pattern as well. Time shall tell which trendline it breaks.
EURUSD

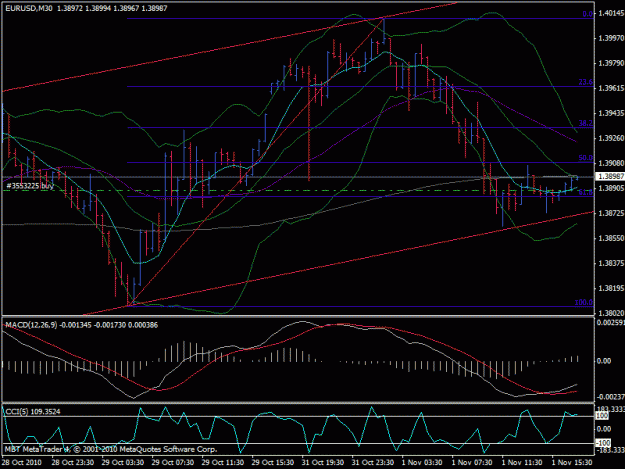
- DKallDAY replied Nov 1, 2010
3rd retest of the trendline. 15m and 30m breakouts failed to gain momentum and don't seem like they're going to push for an hour. Similiar scenario last thursday. Short position taken.
EURUSD
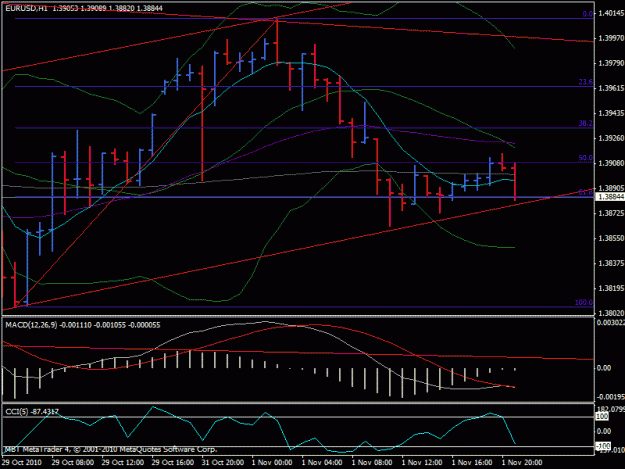
- DKallDAY replied Nov 1, 2010
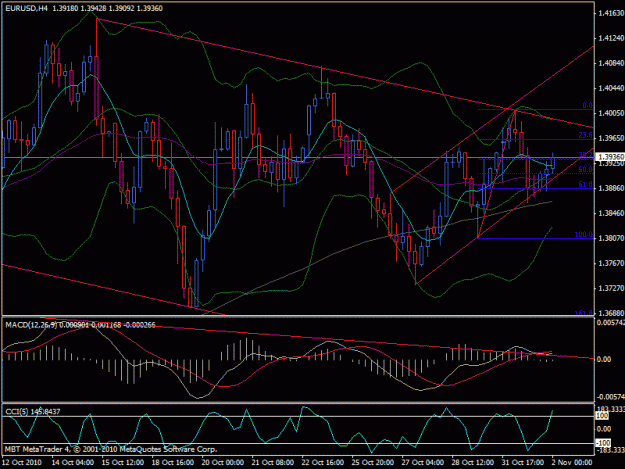
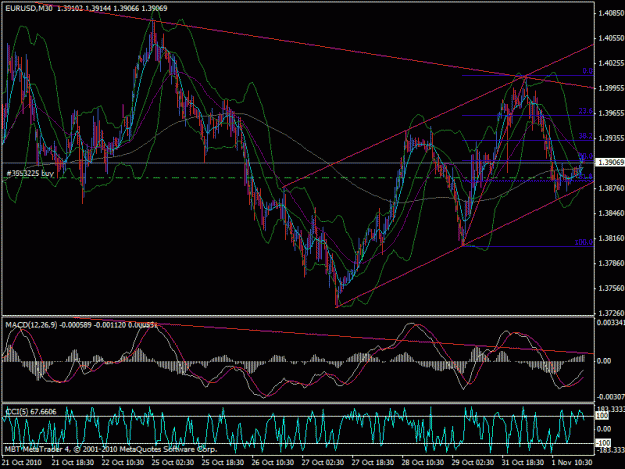
If it does continue up to the upper trendline, it may fill the triangle and breakout upward. The weekly chart pullback either needs to continue or reverse. Wednesday news will tell. How is everyone else feeling on this?
EURUSD
- DKallDAY replied Nov 1, 2010
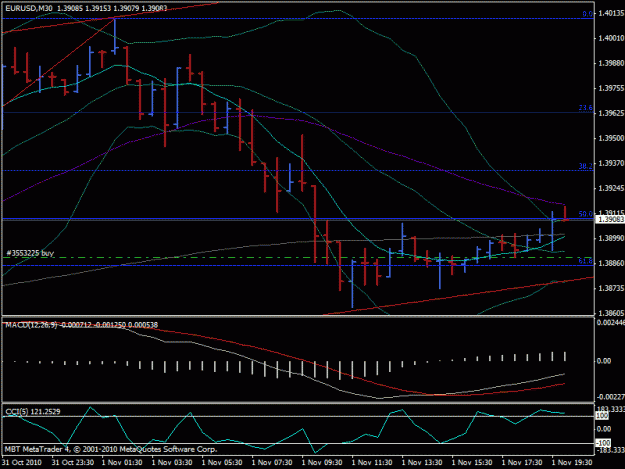
Man just makin money todayyy. All of you earlier who had your shorts, if you're still in them i'd keep it. 30m broke the 20MA now, first 15 now 30, hour is looking to test soon as well. If the hour breaks then maybe we will see a continued uptrend ...
EURUSD
- DKallDAY replied Nov 1, 2010
up 18 pips right now on long, stop moved to 6 point profit 15min breakout confirmed, just waiting on the cross of the 20MA on the 30m for a breakout. Lookin for a touch of at least the top bollie even if the trend isn't continued. 4h is sayin it has ...
EURUSD
- DKallDAY replied Nov 1, 2010
for the 4h, it looks like it slowed it's momentum then doji'd. i wouldn't call it resistance or support until it confirms, but I am long hoping it holds as support. Charts say it is oversold.
EURUSD
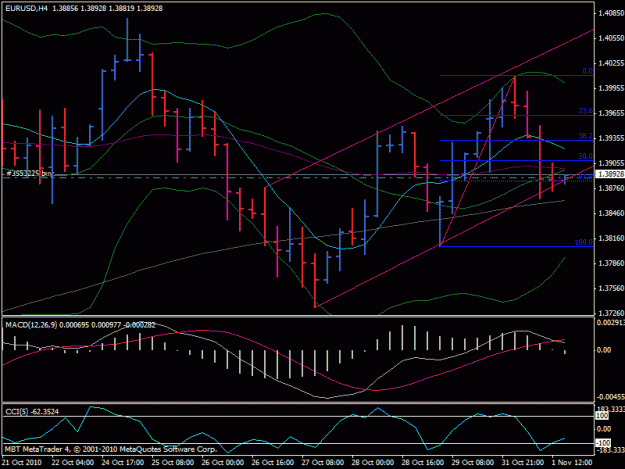
- DKallDAY replied Nov 1, 2010
My chart is sayin bottom reversal from here. Just needs to get that buying pressure in to break the 20MA resistance.
EURUSD

- DKallDAY replied Nov 1, 2010
If that 15m chart can break the 20MA we're prepared for liftoff.
EURUSD
- DKallDAY replied Oct 22, 2010
haha probably a good idea. This is the internet ya know, so everything is entirely personal.
Indicators or none? I just started a thread for the trade psychology I use... surprised there wasn't already one. Check it out: url I talked about it in there, and attached ...
- DKallDAY replied Oct 22, 2010
So! Like I said, I am not familiar with trading naked, no indicators. So please help me learn, I do not mean this as a defense or offensive strike against price action. I'd figure it'd be better to know both than only one side, after all trades, ...
Indicators or none?
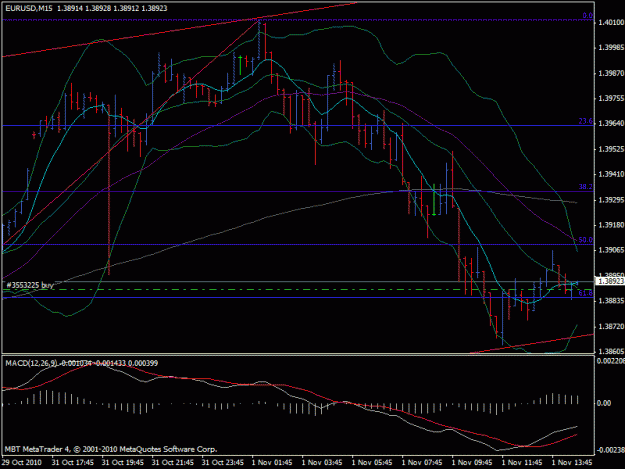
- DKallDAY replied Oct 22, 2010
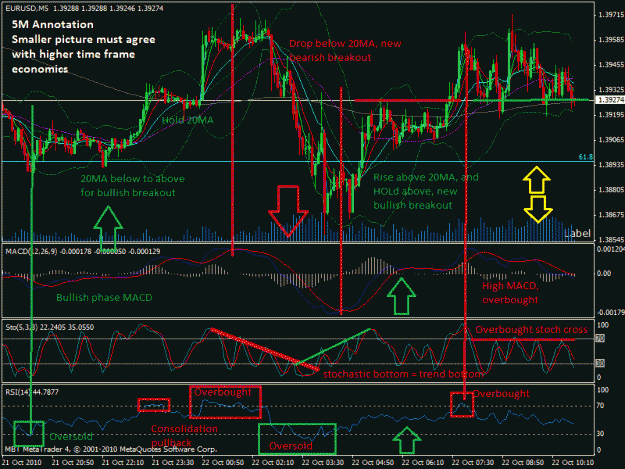
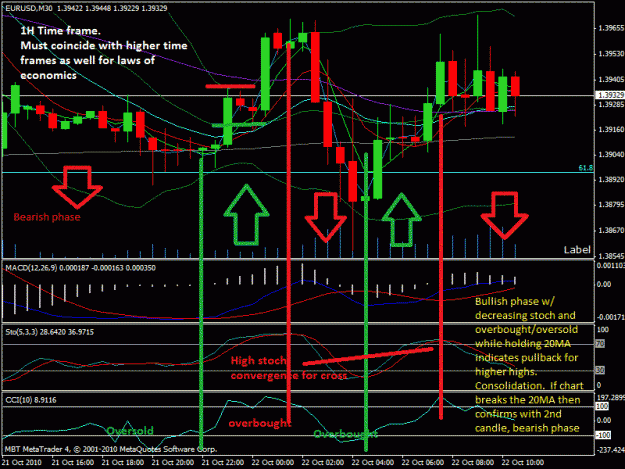
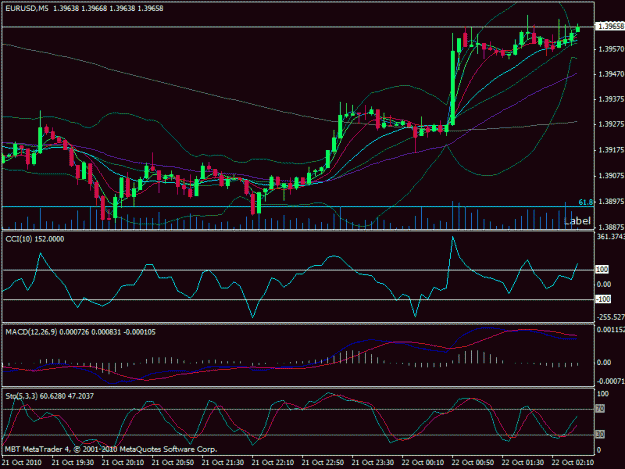
5m holding the 20MA through the bollie squeeze, still in my long position
EURUSD
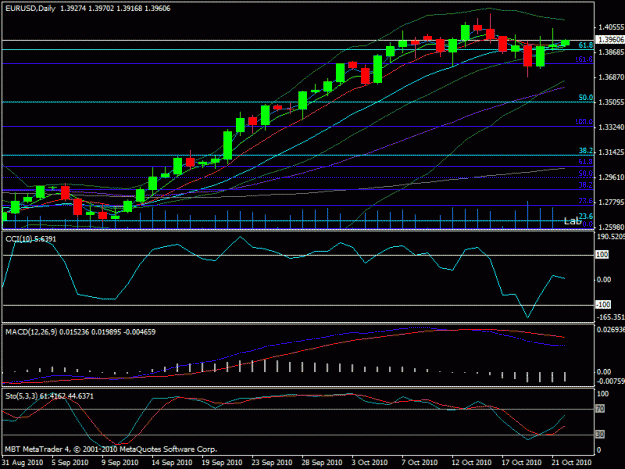
- DKallDAY replied Oct 22, 2010
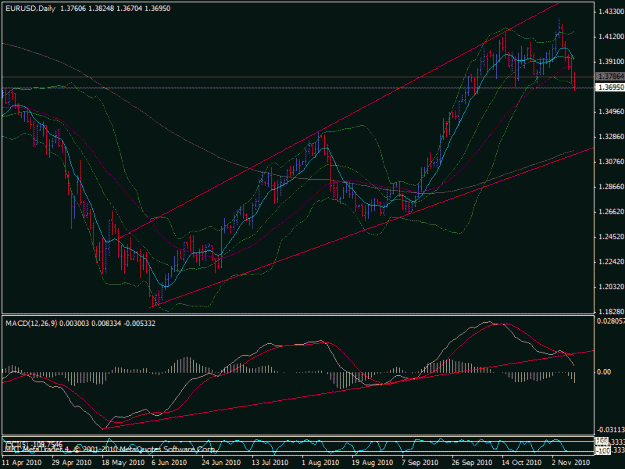
Hahahaha I think the daily chart is sayin: "If I hold this 20MA... I'm seein 1.42 soon... if im making a head and shoulders atm... im gonna candle down through the 20MA and start a much larger bearish phase."
EURUSD ignore the fibs on there
- DKallDAY replied Oct 22, 2010
either we are seeing a new 30m chart breakout or it is forming a sweet head and shoulders. I still am seeing this pullback continuing. long from 1.3920 for the time being, currently holding at the 1st shoulder resistance.
EURUSD