- Search Forex Factory
- 27 Results
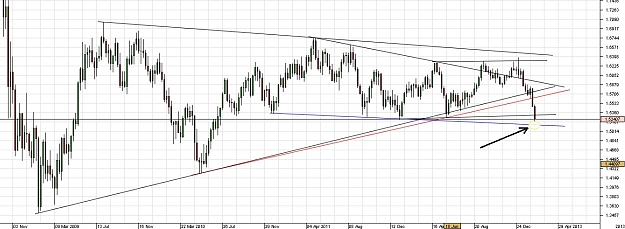
- CasperTrader replied Feb 20, 2013
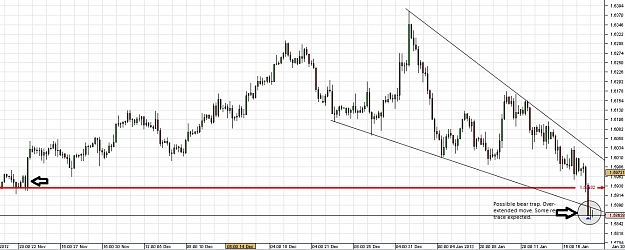
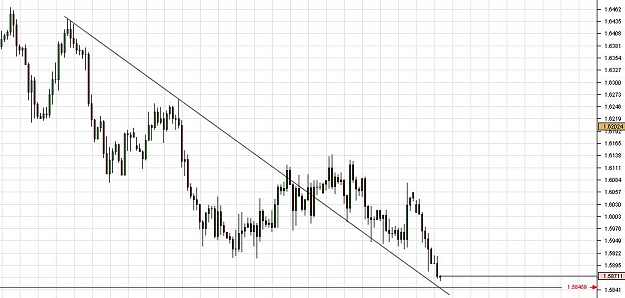
We just hit the Fib 61.8 at 1.5193 for a move from week of May 17th, 2010 to April 25, 2011. If it overextends, the next target maybe the trendline shown in chart.
Cable Update (GBPUSD)
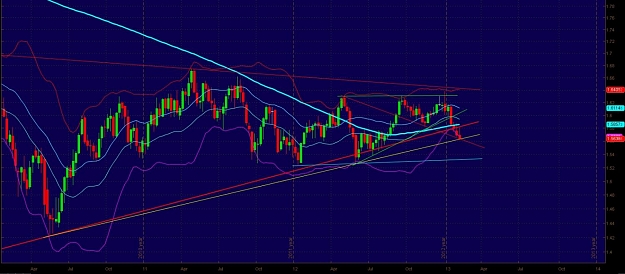
- CasperTrader replied Feb 6, 2013
Hi IBB, do you use logarithmic scale on your price axis? I have found that to be more accurate. In my chart, the breakout's still waiting to happen. If I zoom in to 4H (not attached), 1.5630 is just the exact price where it's making the third touch ...
Cable Update (GBPUSD)
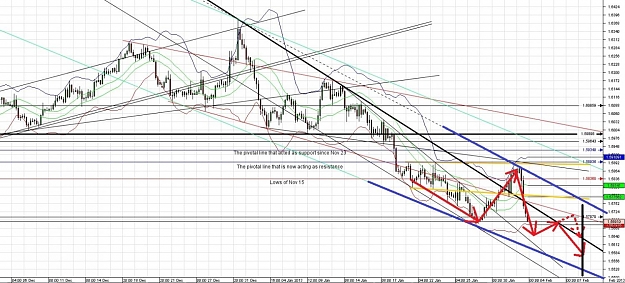
- CasperTrader replied Feb 2, 2013
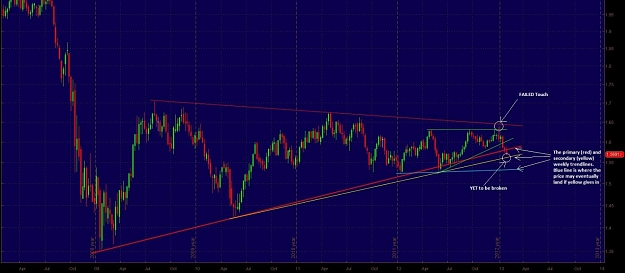
So, I guess it was Fed news/GDP that broke the primary weekly trendline (red; see chart) to the upside (a fakeout) and the NFP to push the price back out again. Not that it was really the news but more of an after effect of news so to say. Looks ...
Cable Update (GBPUSD)
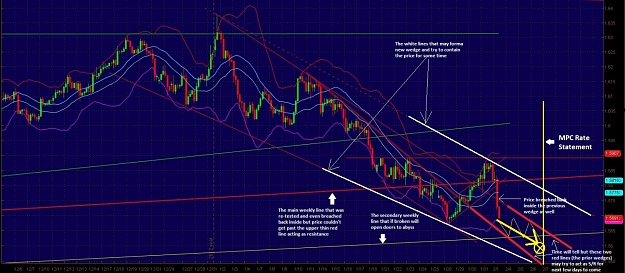
- CasperTrader replied Jan 28, 2013
Cable Update (GBPUSD) It won't look back until majority longers are wiped out. See attached chart. The solid black line in center marks the points where %long vs %short were equal (courtesy Oanda). If you notice, the price doesn't retrace much once it's crossed the ...
- CasperTrader replied Jan 26, 2013
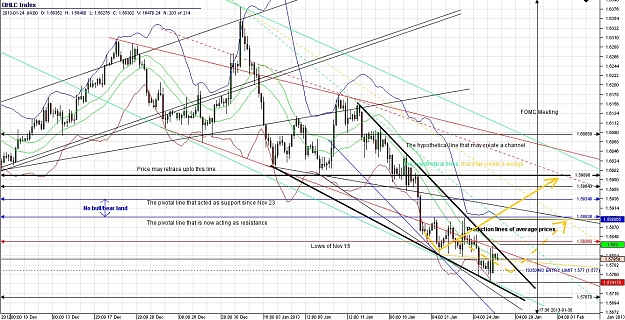
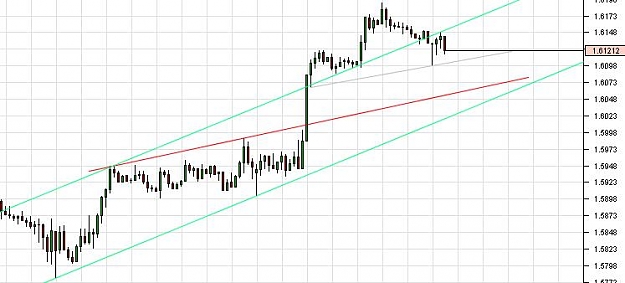
Updated chart from last week. I have not removed the old lines. Just added new ones. The wedge is strong. Not breaking to either side. I was expecting a break below and a sharp reversal from 1.5710 but looks like there's too many buyers sitting ...
Cable Update (GBPUSD)
- CasperTrader replied Jan 20, 2013
That too.
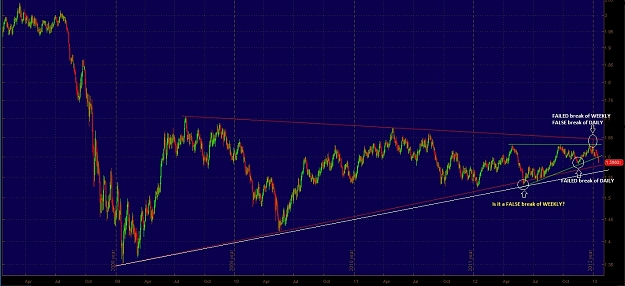
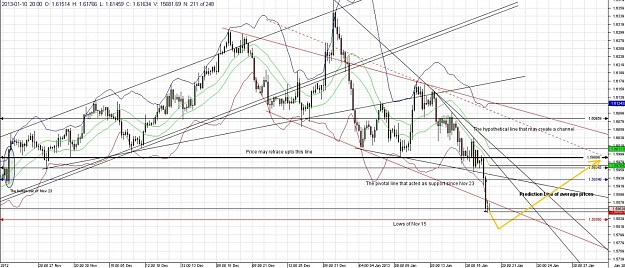
Cable Update (GBPUSD) Very interesting point. It reminded me to look up my GU charts for Daily/Weekly again and something else I have been noticing as well. In the attached chart I have red (for weekly) and green (for daily) trendlines. As you say, ...
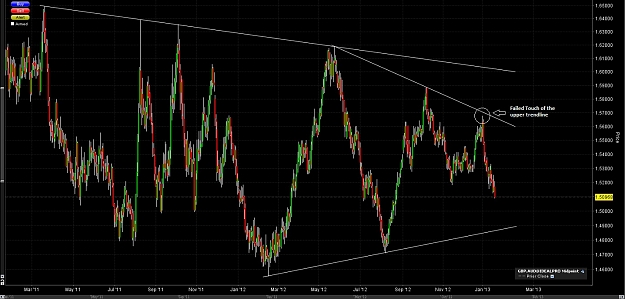
- CasperTrader replied Jan 20, 2013
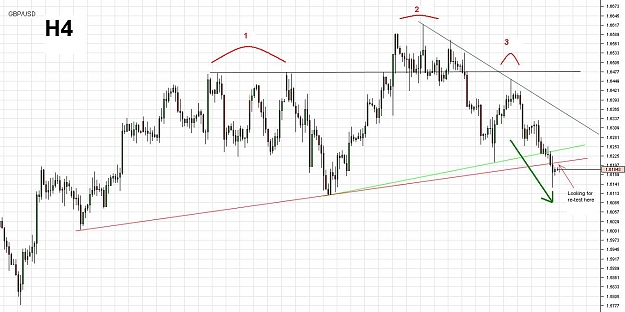
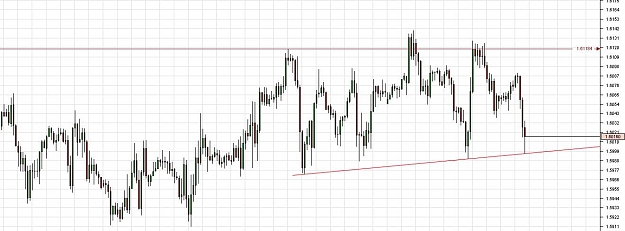
Thanks Tony for pointing out the setup. I had not checked this pair but looks like a great setup to me. One thing, in my observations, if a symmetrical triangle fails touch of either of the trendline (the third touch), it usually breaks out the ...
Cable Update (GBPUSD)
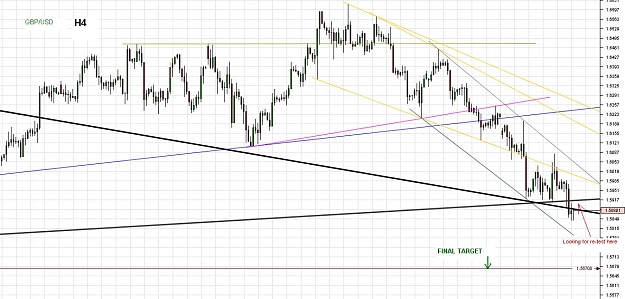
- CasperTrader replied Jan 19, 2013
More detailed chart (4H). My own interpretration. PA is history. We trade the future (based on our expectations/predictions). Of course, it will change as we see more PA. This is for the coming 1-2 weeks just about upto when Fed meets next. 1.6 ...
Cable Update (GBPUSD)
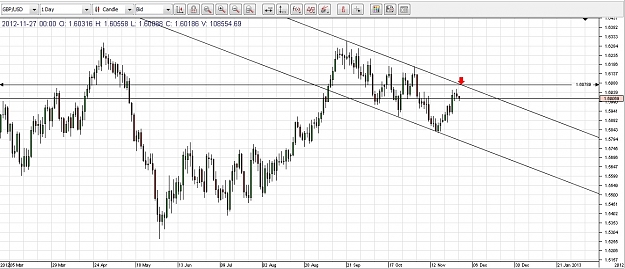
- CasperTrader replied Jan 18, 2013
Chart time. Weekly has closed much below 1.6. Short as of now. Will look to add more around 1.5934 if it gets there. Above that could a bull scenario. That is my interpretation. After all charts only reflect history of prices.
Cable Update (GBPUSD)
- CasperTrader replied Dec 4, 2012
Actually both. Planning to add both at 6140 and 6175. I have a feeling that we might see a very swift move down to 1.57 within next 3-4 weeks.
Cable Update (GBPUSD) I'm probably dreaming.
 See attached.
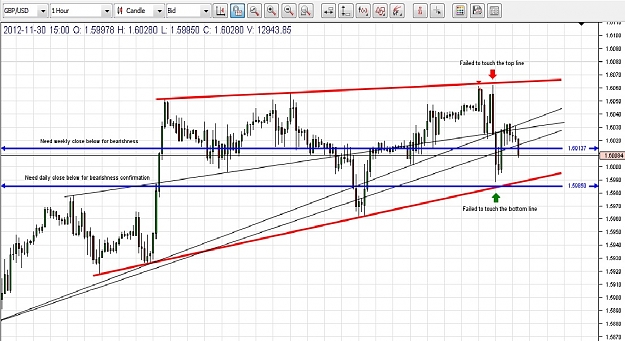
- CasperTrader replied Nov 30, 2012
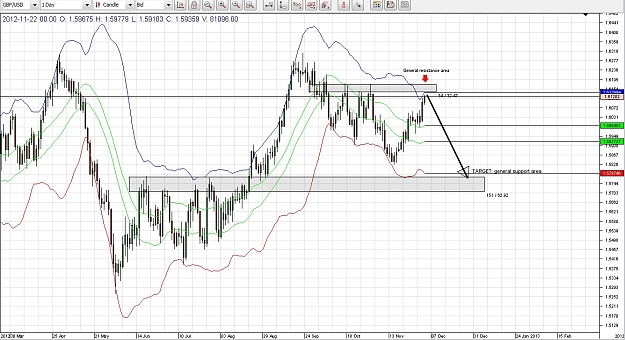
Thanks man. Your inputs kept reminding me to keep an eye on Monthly, Weekly and Daily close and not do any more impulsive trading. I'm still holding my shorts. Last few hours price has been bouncing right in the middle of high 1.6062 and low of ...
Cable Update (GBPUSD)
- CasperTrader replied Sep 14, 2011
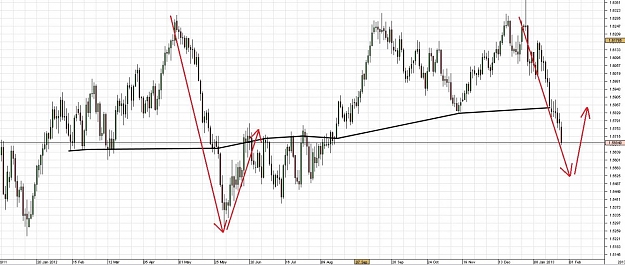
Target approaching. Looking to buy here. At least expecting some bounce off here. This also seems to be close to the lower trendline on Daily (attached) and around the lower Bollinger level on the weekly. It may actually range here for a week or so ...
Cable Update (GBPUSD)
- CasperTrader replied Sep 9, 2011
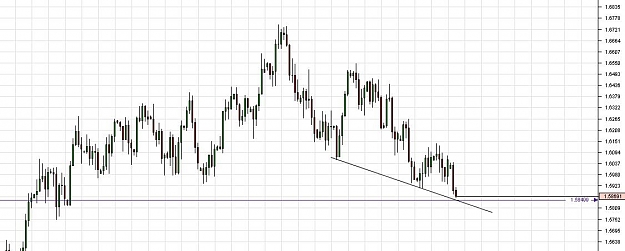
Looks like it's playing out. Does anyone know what should be the target for H&S? I've depicted mine in the chart.
Cable Update (GBPUSD)
- CasperTrader replied Sep 1, 2011
Another Possibility — My view. Comments welcome.
Cable Update (GBPUSD)
- CasperTrader replied Jul 14, 2011
Why is that my daily is different from yours? What time does your chart "day" start? Mine starts at 00:00 hrs GMT.
Cable Update (GBPUSD)
- CasperTrader replied Jul 12, 2011
Thanks guys. I also see a daily and hourly confluence of bollinger around 1.5855. Price might bounce back from here as well. Just another possibility. To add to that, around 1.5850 seems to be the extension of the lower daily trendline as pointed ...
Cable Update (GBPUSD)
- CasperTrader replied Jun 29, 2011
GU - 1 HR — It's not going anywhere unless it breaks out of this range which at times if I remember can last for several days. Until then range trading. I would bet on it breaking out downside whenever that happens but again anything can ...
Cable Update (GBPUSD)
