- Search Forex Factory
- 18 Results
- BeeCee replied Apr 3, 2018
Hi Team, It has been some time that I had put in charts. I was busy on my day job and in the time I got I was going through the old thread and practising. (Not even 30% yet). Just a test of my understanding, I will only go for a long trade when boss ...
Strat's PASR Long Term, Stress Free Trading
- BeeCee replied Mar 15, 2018
Hi Strat, Attaching the chart with the worker resistance at 1.8147. Feedback taken strat. Will look for Boss chart to make a decision on buying. THanks Beecee
Strat's PASR Long Term, Stress Free Trading
- BeeCee replied Mar 15, 2018
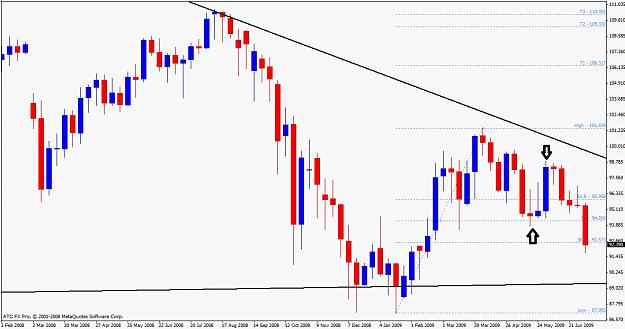
Hi Strat, In the old thread, you had posted a chart. Posting it again for your reference. I have marked a recent swing with black arrows (You can see the blue candle high exceeding the red candle high). However you had taken the fibs from the ...
Strat's PASR Long Term, Stress Free Trading
- BeeCee replied Mar 14, 2018
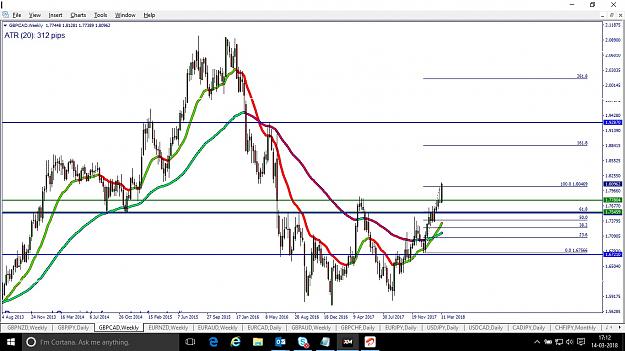
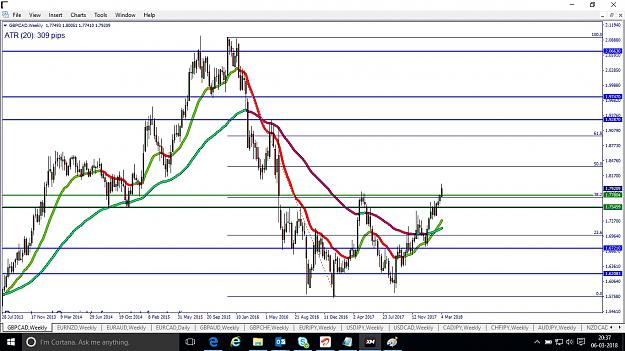
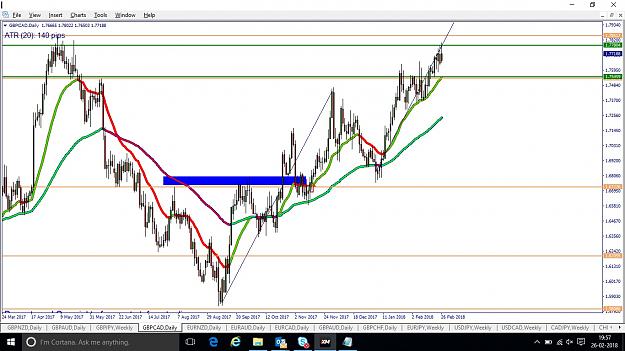
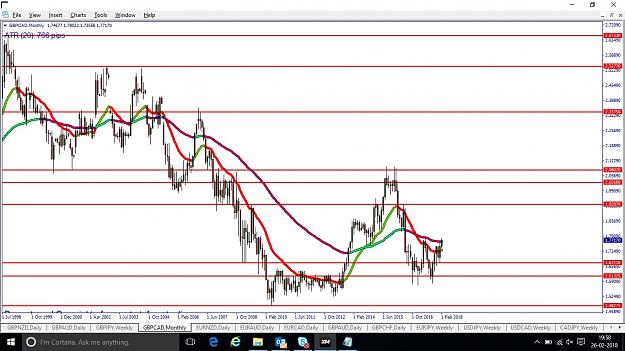
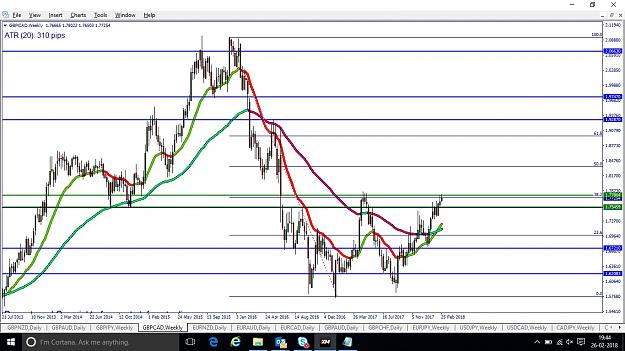
Hi Team, GBPCAD trade identification BB: Longterm down trend and immediate uptrend. Couple of HLs. Signficant resistance has been crossed (On-going candle, however price did not close above the resistance to be noted. Only by the end of this month ...
Strat's PASR Long Term, Stress Free Trading
- BeeCee replied Mar 14, 2018
Hi Strat/Yoki and others. Same pair and result, however different perspective. Request your feedback. BB: Downtrend. Price in a triangle. Boss: Downtrend. how do you confirm the downtrend from an uptrend. Here you go. Based on my understanding from ...
Strat's PASR Long Term, Stress Free Trading
- BeeCee replied Mar 6, 2018
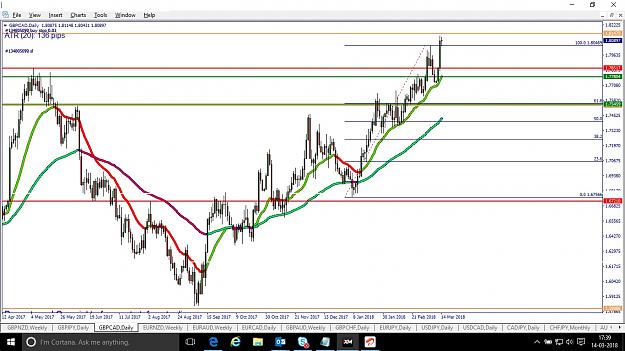
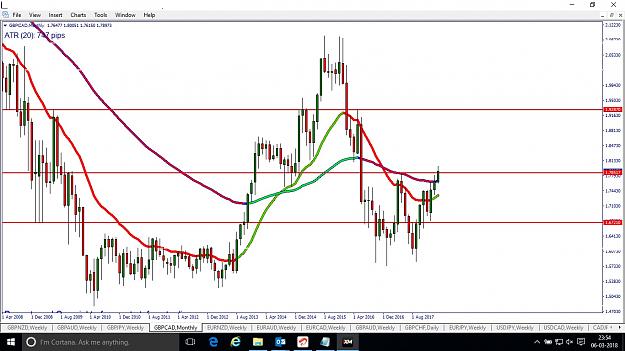
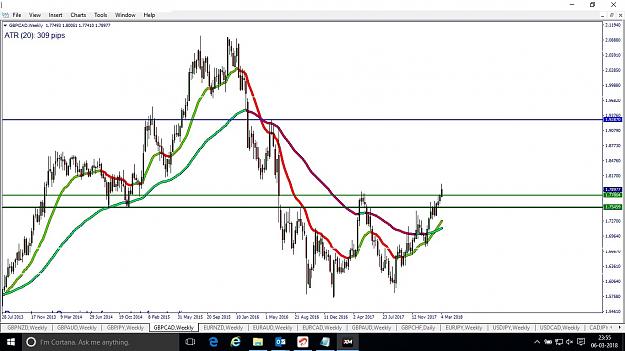
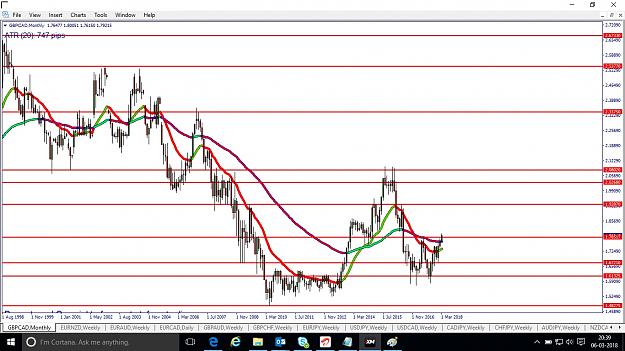
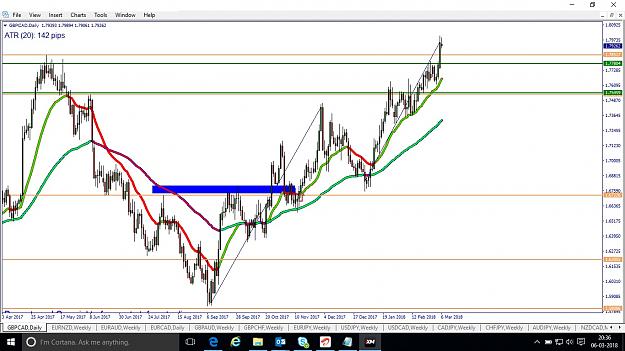
Hi All, Taking a trade. Attached are the charts. GBP CAD Bigboss: intermediate uptrend in a long term downtrend. Boss: price has decisively taken an uptrend by breaking the previous HH on 30.4.2017. However price has not closed yet beyond that. ...
Strat's PASR Long Term, Stress Free Trading
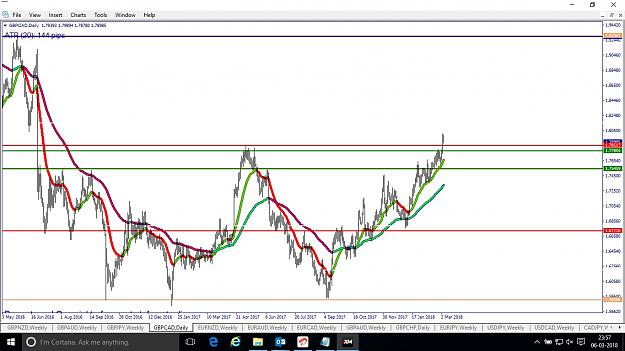
- BeeCee replied Mar 6, 2018
Hi All, Taking a trade. Attached are the charts. GBP CAD Bigboss: intermediate uptrend in a long term downtrend. Boss: price has decisively taken an uptrend by breaking the previous HH on 30.4.2017. However price has not closed yet beyond that. ...
Strat's PASR Long Term, Stress Free Trading
- BeeCee replied Feb 28, 2018
Hi Strat, Going forward will request feedback from everyone.. Your trend line is not drawn correctly. PASR always draws trend lines from the root through significant swings - Try again - What is a significant swing. I am understanding this as any ...
Strat's PASR Long Term, Stress Free Trading
- BeeCee replied Feb 28, 2018
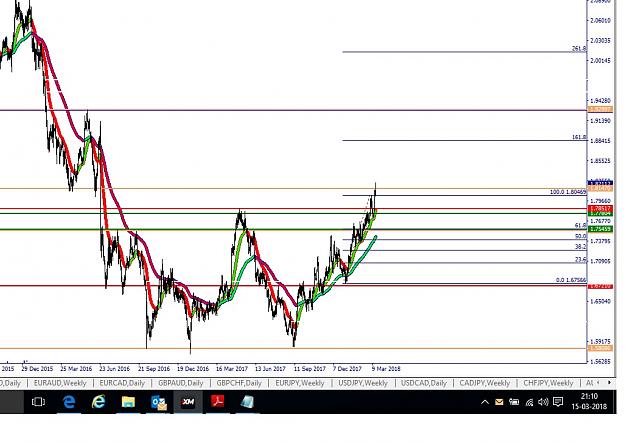
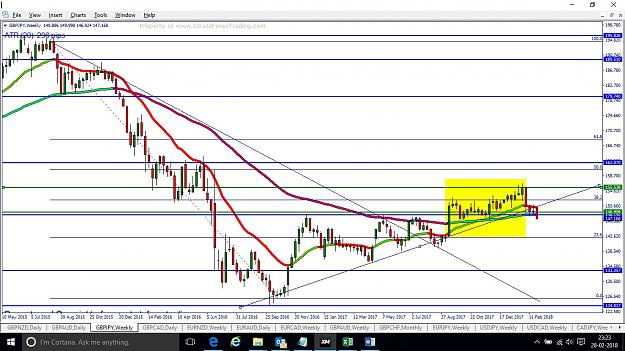
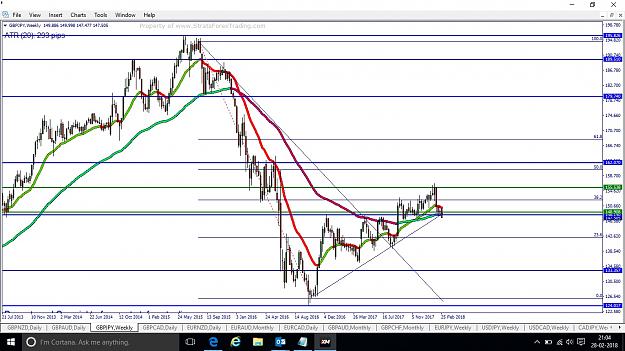
Hi Strat, Another analysis on GBP JPY. Looks like interesting times ahead. Big Boss: Long term down trend and immediate uptrend. Big boys didn't show interest on this pair for the last few months. However, now they seem to be interested in pushing ...
Strat's PASR Long Term, Stress Free Trading

- BeeCee replied Feb 26, 2018
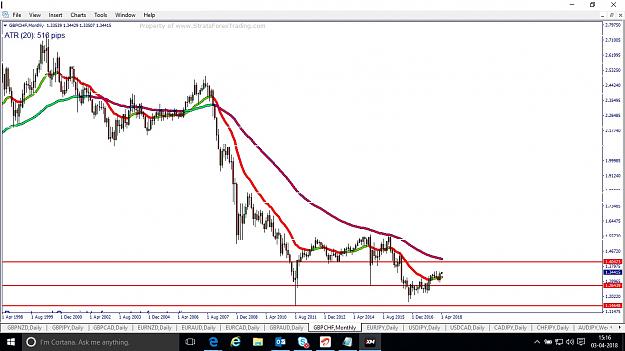
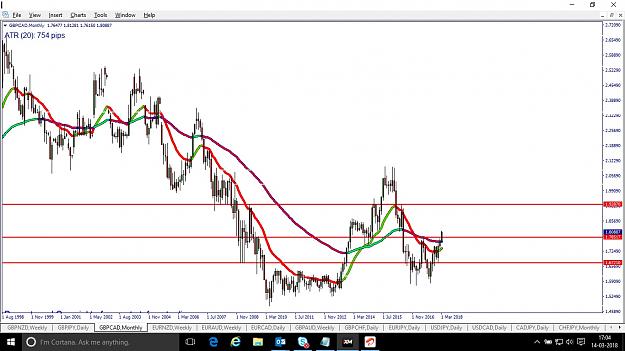
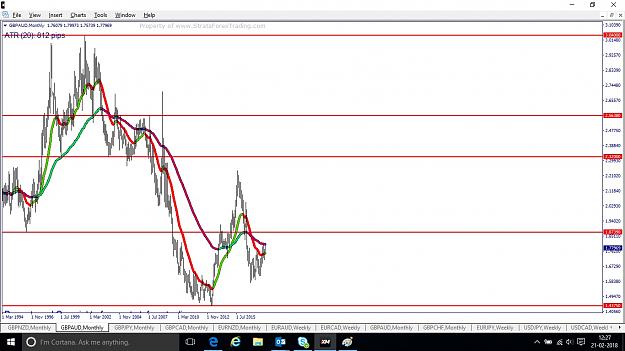
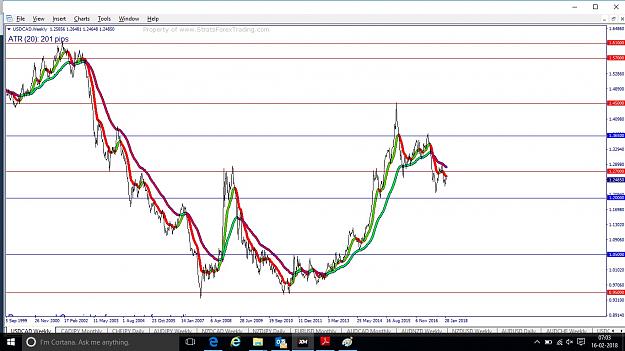
Hi Strat, My first analysis as part of my learning the old thread. I know there will be errors as part of my learning curve. Bigboss: Long term down trend - from 1997 onwards. Intermediate trend - upper trend with month august hitting 2.08. ...
Strat's PASR Long Term, Stress Free Trading
- BeeCee replied Feb 21, 2018
Hi Strat, Thanks for the compliments and for the charts. I studied your charts. I tried to follow those in the attached charts. 1. I have mostly taken the low/high of the bars (swing low/swing high) to be more specific rather than 'the open/close' ...
Strat's PASR Long Term, Stress Free Trading
- BeeCee replied Feb 20, 2018
Hi Strat, Like I promised, I have gone back to the old thread. This time spending more time on each post from you and other strat certified trainers. Just wanted to test my understanding on S and R here. I have just taken the 1st chart and drawn the ...
Strat's PASR Long Term, Stress Free Trading
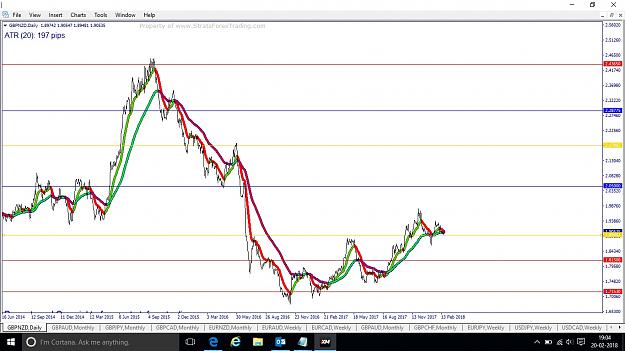
- BeeCee replied Feb 16, 2018
Hi Strat, Is the Identification of WCC right. The 3rd candle from the right. Before that was the 5th candle from the right.
Strat's PASR Long Term, Stress Free Trading
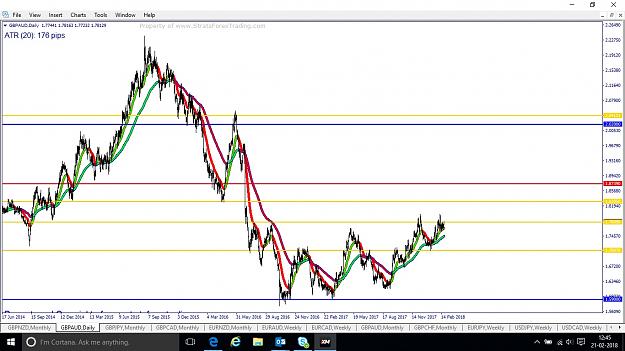
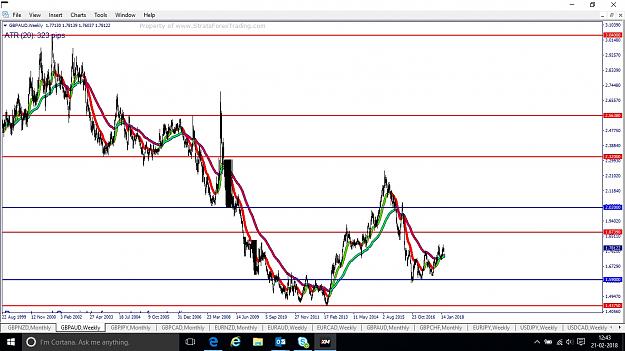
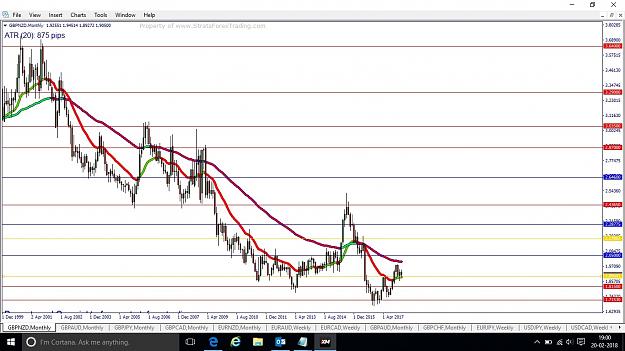
- BeeCee replied Feb 16, 2018
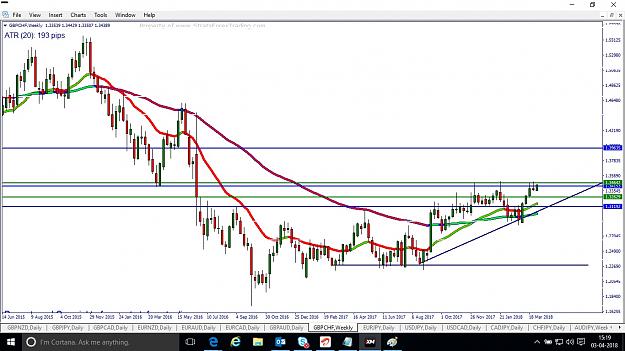
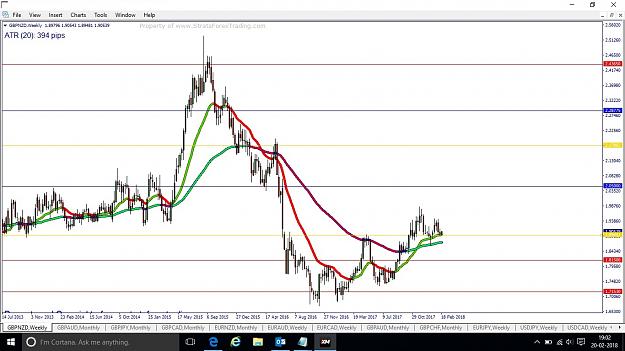
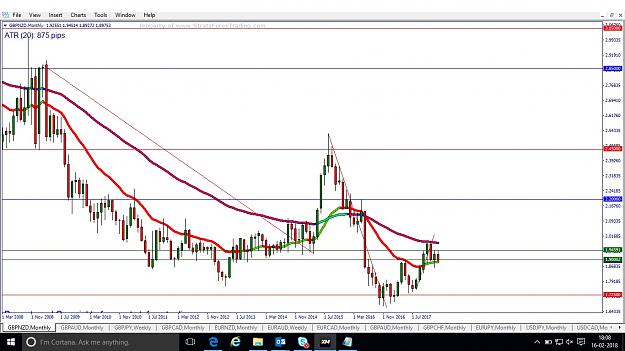
Hi Strat, Attached are the monthly and weekly charts of GBP NZD. one of the very basic questions. I want to learn to find the primary trend. (as I am level zero, however want to improve). Weekly chart. How should I determine what trend is it now. Is ...
Strat's PASR Long Term, Stress Free Trading
- BeeCee replied Feb 15, 2018
Hi Strat, You know I am at level 0. Please bear with me. True to my last statement, I went back and tried learning to plot the support and resistance lines. I have made it in the chart attached. Could you tell me whether what I have done is right. ...
Strat's PASR Long Term, Stress Free Trading
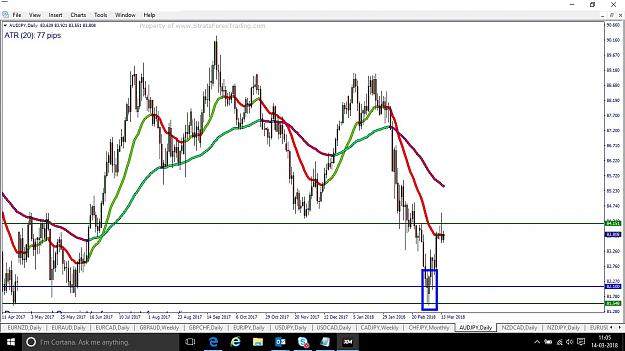
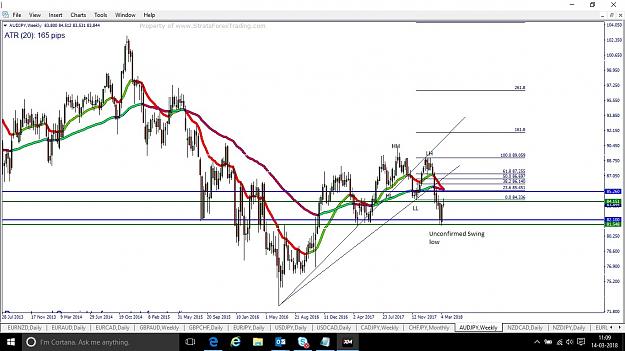
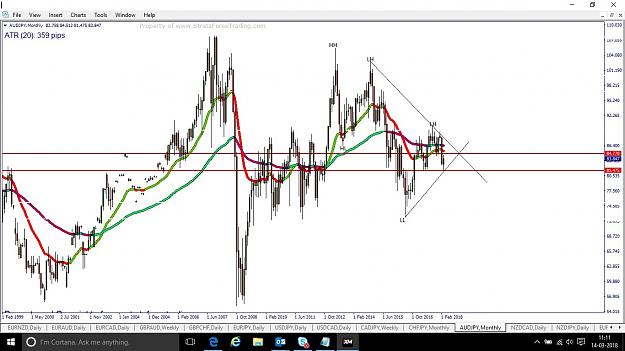
- BeeCee replied Feb 13, 2018
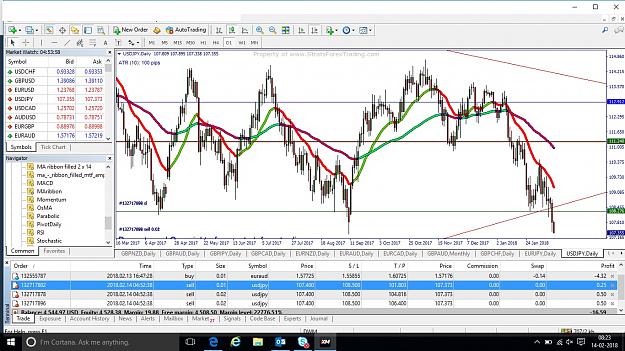
Hi Strat, Enclosed are USD JPY charts. 1. In the monthly charts (big boss), the immediate trend is bearish. while the long term trend is Flat. I have put in the trend lines. It is broken near WCC. 2. In the weekly chart(boss) trend is bearish ...
Strat's PASR Long Term, Stress Free Trading

- BeeCee replied Feb 13, 2018
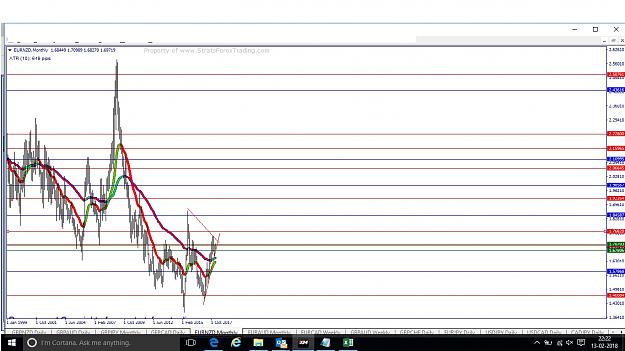
Hi Strat.. In the quoted post you had shown AUD CAD on Downtrend and consolidation. Enclosed is the screenshot of EURNZD. Its a long term downtrend and immediate uptrend in the Bigboss chat. Would you recommend a buy for a scenario like this when ...
Strat's PASR Long Term, Stress Free Trading
- BeeCee replied Feb 12, 2018
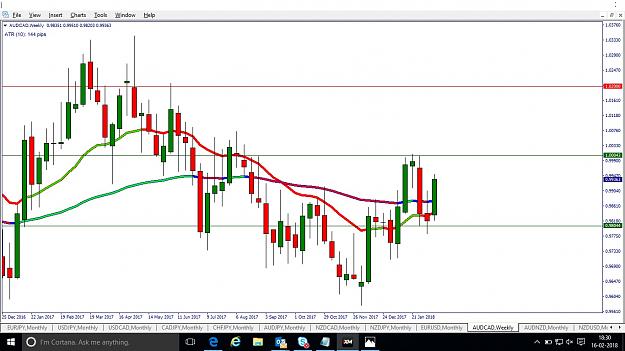
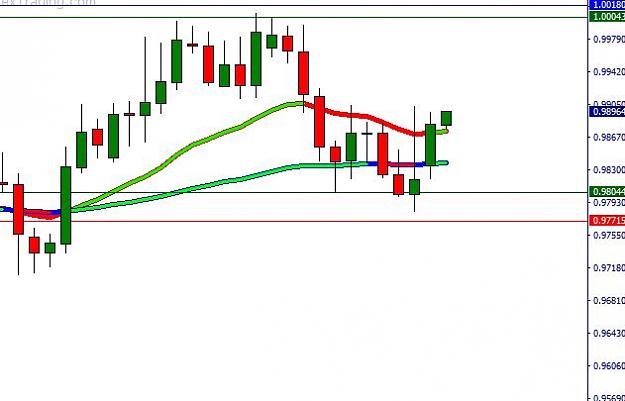
Hi Strat, I am a newbie. Spent quality hours reading your old thread and new one. I want to adapt to this strategy. Request your view whether my assumption of trading AUD CAD today is right. I am still demo trading. However, I want to practice well ...
Strat's PASR Long Term, Stress Free Trading
- Posts by Member Search: 'BeeCee'