- Search Forex Factory
- 105 Results
- Barak's pip replied Dec 30, 2008
hi again , it's a good point , when you look at it that way ,a lot of pairs are in a-b-c's or 1-2-3's for years , check out usdjpy . for the nearest future , I preffer the plan in the attached chat - when a break of 1.3825 will change it , but for ...
Elliott Wave Trading
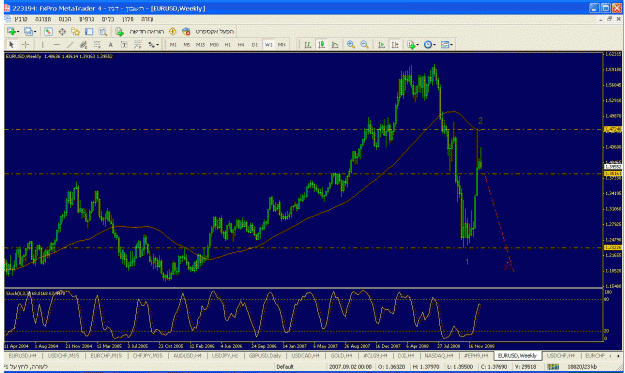
- Barak's pip replied Dec 29, 2008
hey , so , if I got you ok , you think we haven't seen yet wave no. 3 . as in the chart attached ?
Elliott Wave Trading
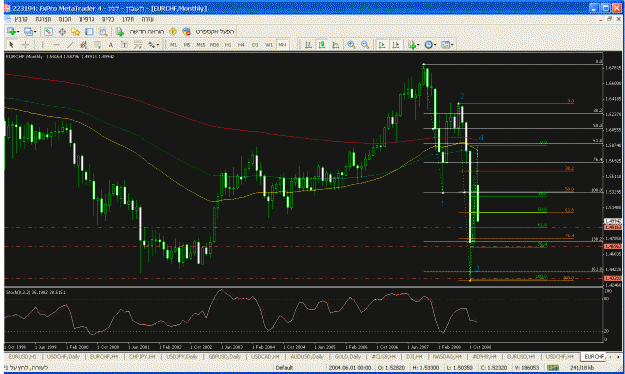
- Barak's pip replied Dec 28, 2008
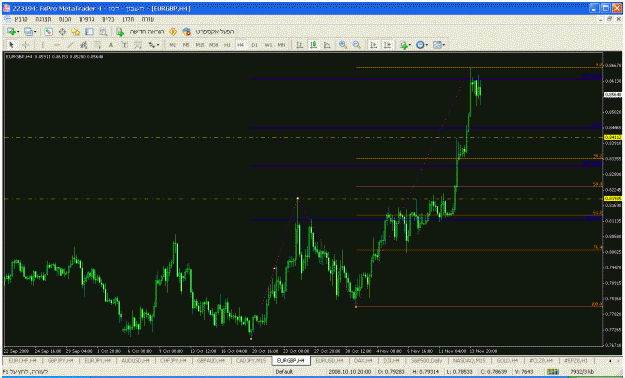
eur\chf — what do you say about this count on the monthly chart?
Elliott Wave Trading
- Barak's pip replied Dec 23, 2008
chf\jpy — a lot of attention to the chf , what do you think about this count?
Elliott Wave Trading

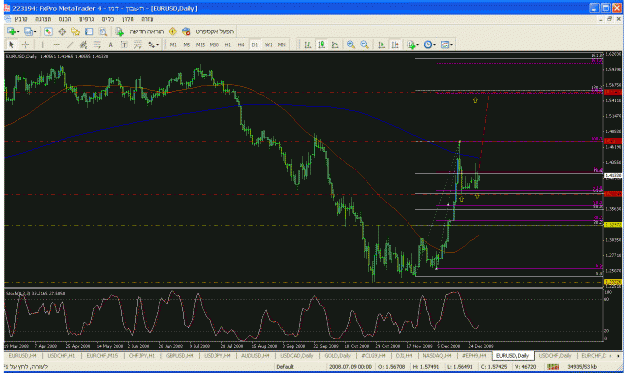
- Barak's pip replied Nov 16, 2008
hey guys , what do you think about that one , going north?
No Brainer Trades
- Barak's pip replied Nov 15, 2008
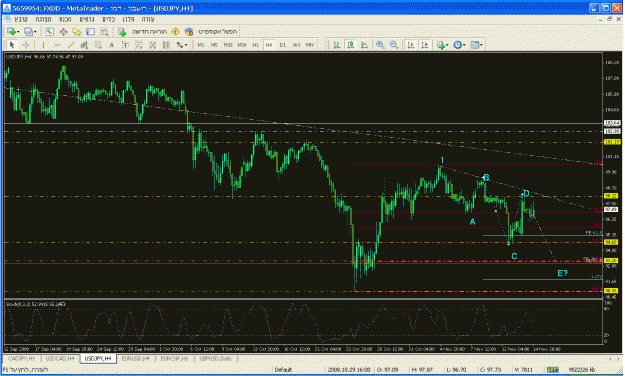
usdjpy , hey guys , what do you think about that wave count ? Barak
Elliott Wave Trading
- Barak's pip replied Nov 14, 2008
thanks buddy , you were right , I meant the current build up arround 1.4900 , do you think that it won't break it up? did you see my question to you concerning Elliot waves ? Barak
No Brainer Trades
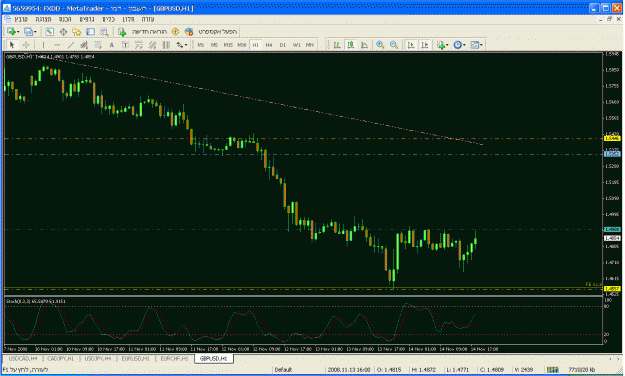
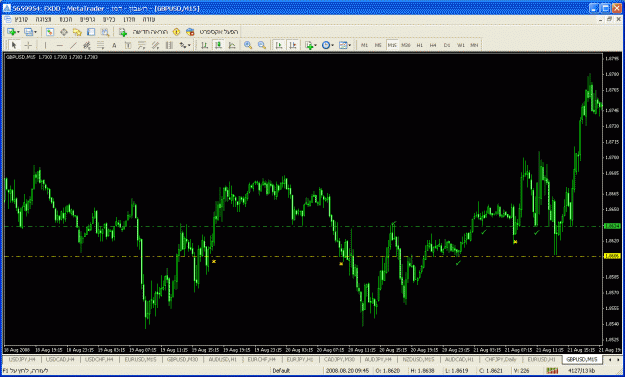
- Barak's pip replied Nov 14, 2008
hey guys , what do you think about that build up on cable ? do you think it gonna break it ?
No Brainer Trades
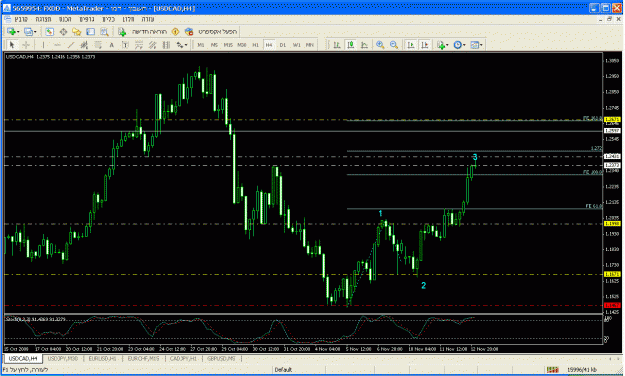
- Barak's pip replied Nov 12, 2008
hi there , what do you think about my wave count? attached - chart of usdcad, hope for your comments, Barak
Elliott Wave Trading
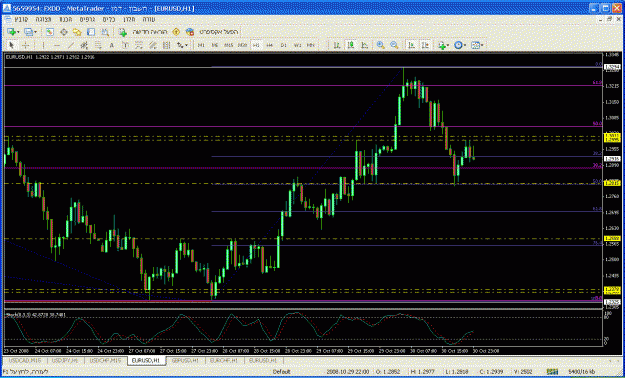
- Barak's pip replied Nov 12, 2008
hi dude, thank you for replying , I'm not sure what's going with this pair , it doesn't obey anything in the last couple of days , in terms of r&s and corellation with indices,oil & gold , maybe there is goverment intervension , or some big buyers ...
No Brainer Trades

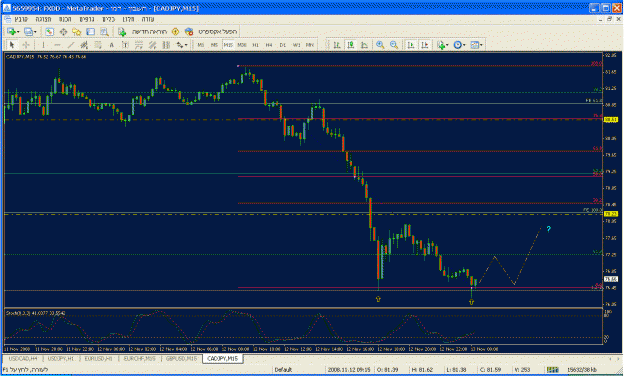
- Barak's pip replied Nov 7, 2008
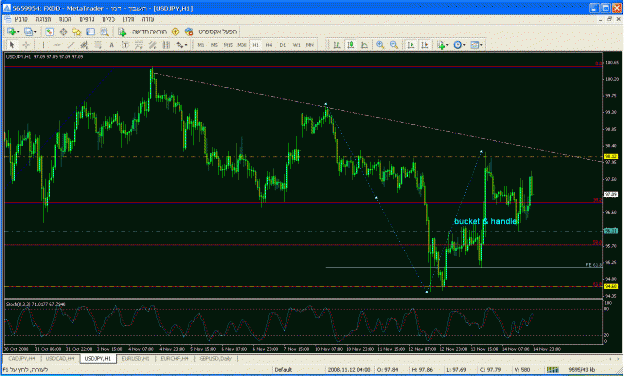
hi BRV , latelly you are talking a lot about price action and patterns that you recognize ... is there anything more then the buckets ? I will be happy to learn more patterns , since it gives more aprroval for potential trades. here is one pattern I ...
No Brainer Trades
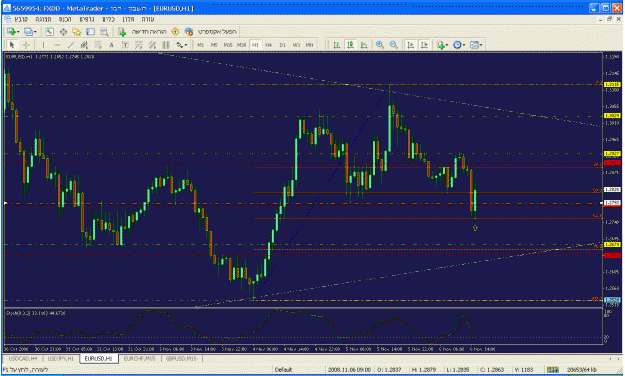
- Barak's pip replied Nov 6, 2008
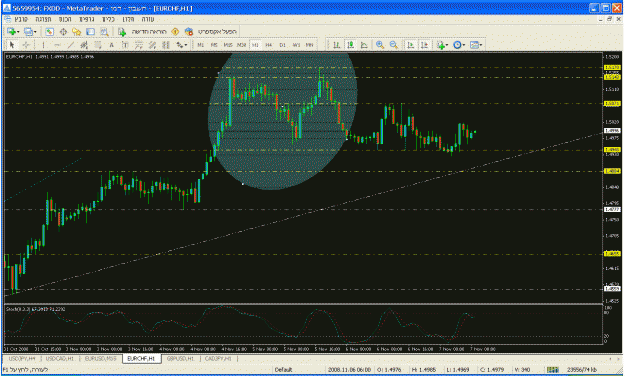
how do you see this ... as a resistance that about to break or like a good resistance that holds?
No Brainer Trades
- Barak's pip replied Nov 6, 2008
was there any statement that they will do so ? in another matter - look how that 61.8 level turned arround the market in 100 pips ... I guess that in some cases the fib levels are stronger then the s&r? if it is , how do you know when?
No Brainer Trades
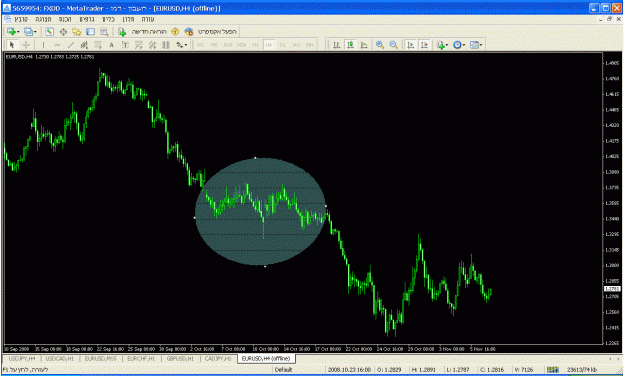
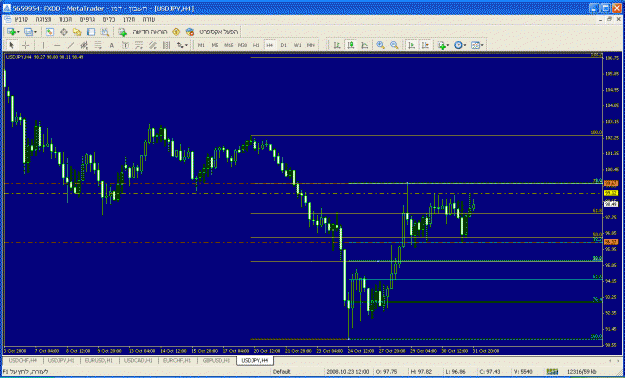
- Barak's pip replied Nov 1, 2008
nice video BRV ... how do you decide where to put the stoploss and take proffit points on a break out trade? like in the case on the chart attached , usd\jpy is trapped between 2 levels and breakout can be to both ways , where would you choose to ...
No Brainer Trades
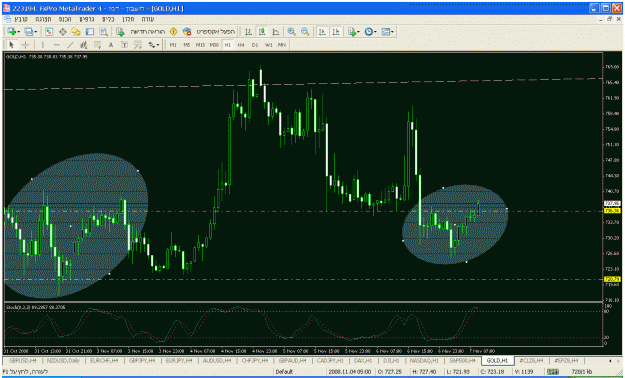
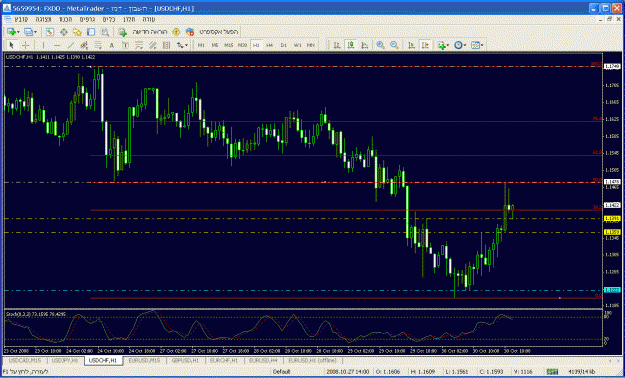
- Barak's pip replied Oct 30, 2008
what we have here is a strange situation - on one hand the wall st. indices closed on the green side on the other hand the gold and the oil keeps falling - the result is that the dolar not moving , from the fibonacci point of view both ways north ...
No Brainer Trades
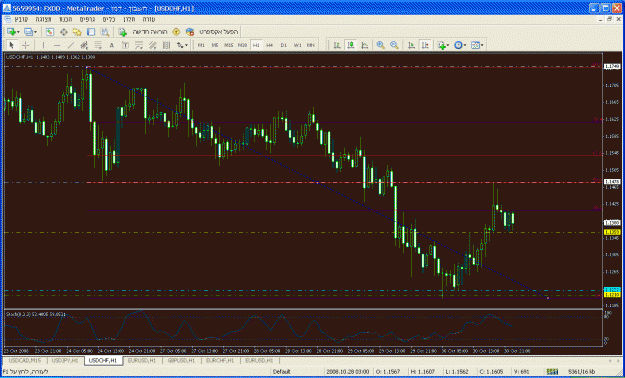
- Barak's pip replied Oct 30, 2008
it is strange times , take a look at the chart attached - we have a respect of the 50 fib level which is also a res. , but price is now going to test it again , it happened few times during the day , I guess asking for clean moves are too much this ...
No Brainer Trades
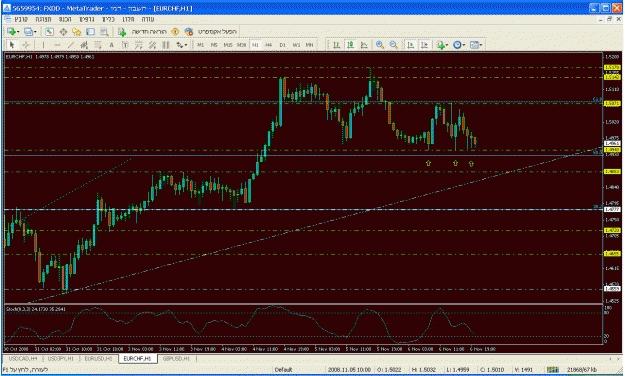
- Barak's pip replied Oct 18, 2008
good\bad bucket (s&r) — I know this question has been asked a million times , and I know the answers are on the pdf file (which I read many times!) , but let me try and reffer you to the chart attached - there was one line that made some ...
No Brainer Trades
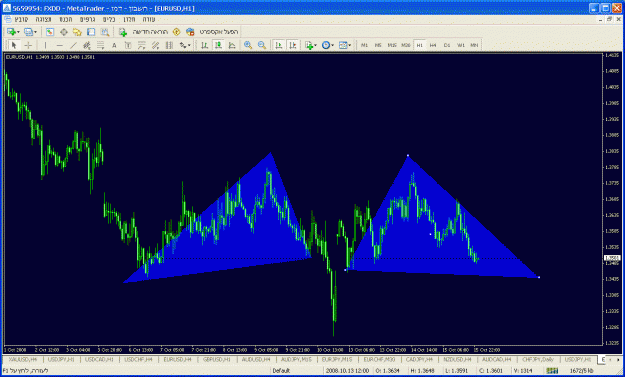
- Barak's pip replied Oct 15, 2008
gartlley — Hi guys, I think it's a Gartley pattern , I'll appriciate it if someone here that knows this pattern can explain which one is it (bearish\bullish?) Thanx, Barak.
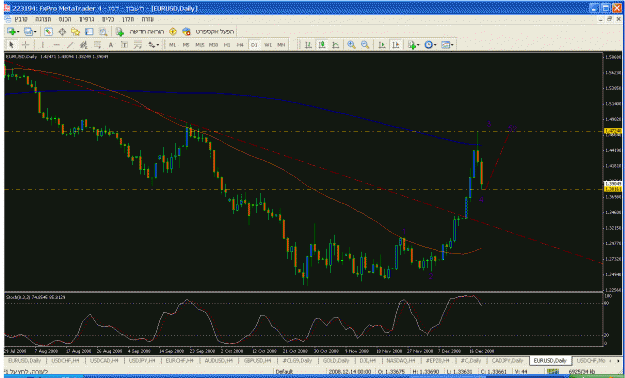
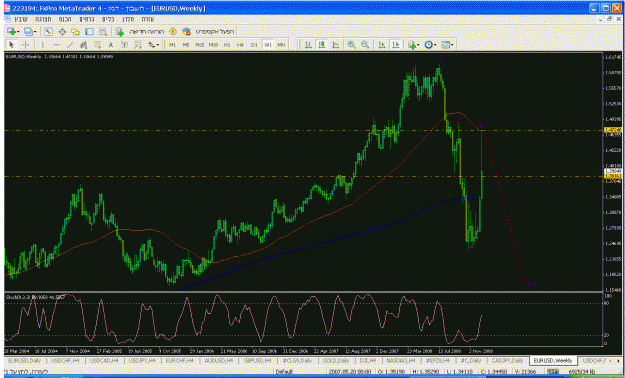
EURUSD