- Search Forex Factory
- 74 Results
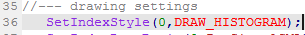
- Ah-Ong replied Dec 22, 2020
Change original OsMA.mq4 at line 36 from DRAW_HISTOGRAM to DRAW_LINE, make a good visual view for divergence.
Hidden divergence image image file

- Ah-Ong replied Aug 31, 2020
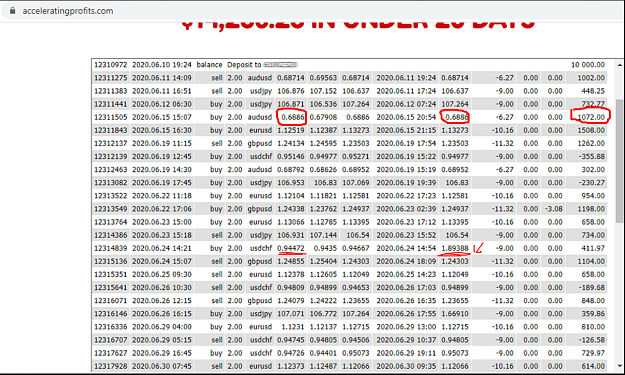
The Data speak.
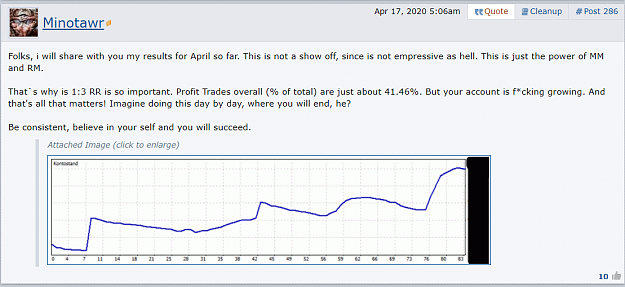
What I learned after losing $300,000 trading forex
 Suppose your analysis shows that EURUSD going to go down today and you try to sell it. Now price open & goes up to 0.20% (below 0.25%), from the chart below if your sell it, your probability for the ...
- Ah-Ong replied Aug 31, 2020
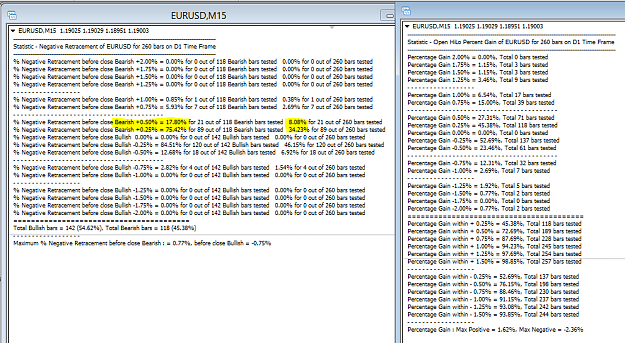
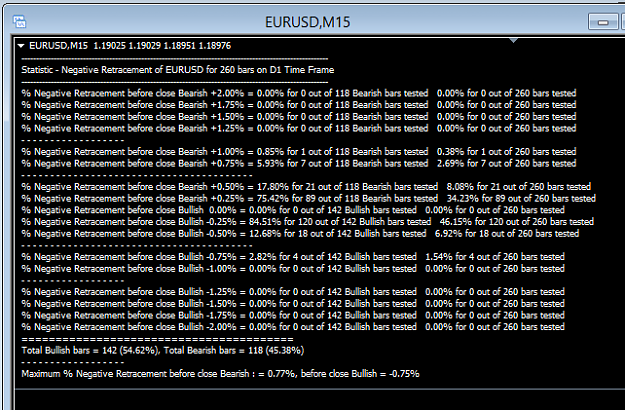
Another indicator that may be useful. The indicator calculates how much retracement for the price goes down before it goes up and closes Bullish. My own definition : Negative Retracement before close Bullish --> Price Open and retrace negative (Go ...
What I learned after losing $300,000 trading forex
- Ah-Ong replied Aug 30, 2020
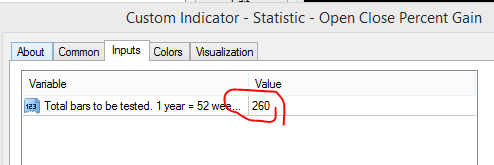
Just change the total bars to be tested. 1 year = 52 weeks x 5 days = approx. 260 bars 3 month = 3 x 4 weeks x 5 days = approx. 60 bars image
What I learned after losing $300,000 trading forex
- Ah-Ong replied Aug 30, 2020
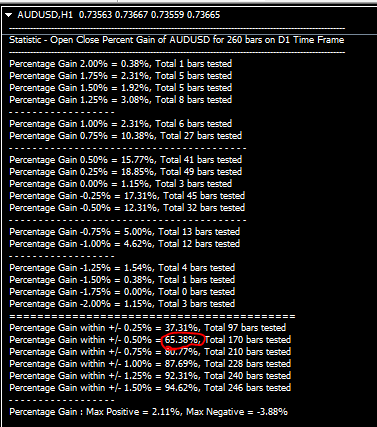
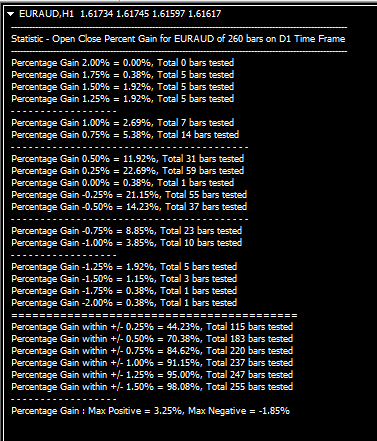
AUDUSD should b 65.38% over 260 bar (one year). Correct me if I am wrong.
What I learned after losing $300,000 trading forex image
- Ah-Ong replied Aug 30, 2020
Percentage gain within -0.75% mean total no of days which price travel from open price to low of the day is within 0.75% Below is the logic behind it. image
What I learned after losing $300,000 trading forex
- Ah-Ong replied Aug 30, 2020
simply the percentage change of Close versus Open (close - open) / open x 100%
What I learned after losing $300,000 trading forex
- Ah-Ong replied Aug 30, 2020
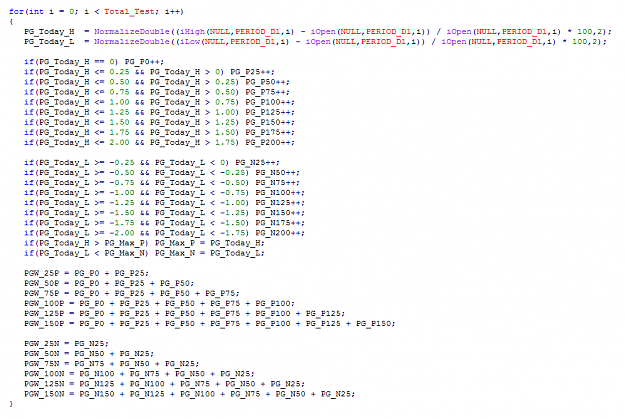
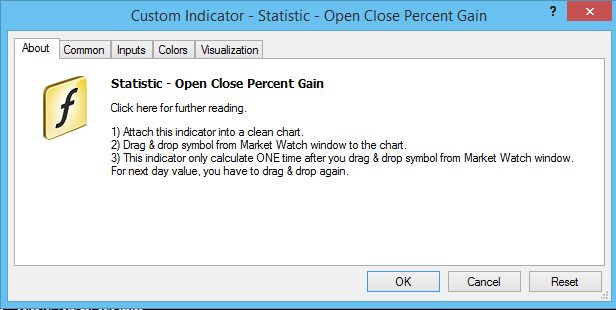
Here is the indicator calculates the statistic of percentage gain for Open to High & Low. The result may slightly different for different brokers. Let me know if the calculation wrong.
What I learned after losing $300,000 trading forex image New update version at url

- Ah-Ong replied Aug 30, 2020
The BEST is EURCHF. 94.62% within +/- 0.50%
What I learned after losing $300,000 trading forex image

- Ah-Ong replied Aug 30, 2020
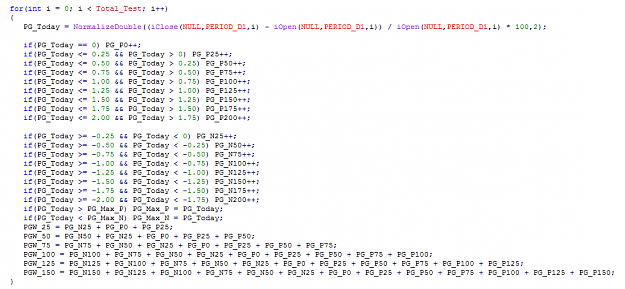
A simple indicator calculates the statistic of percentage gain for Open to Close. The result may slightly different for different brokers. Let me know if the calculation wrong.
What I learned after losing $300,000 trading forex image image file
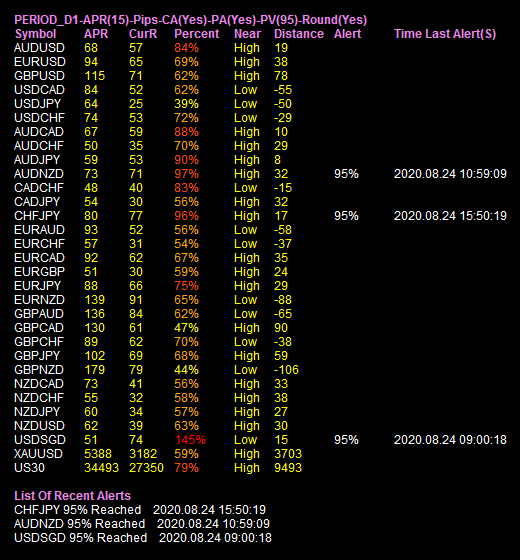
- Ah-Ong replied Aug 24, 2020
Profit for the day
Daily Trading Strategy [ADR + RSI = High Probability] image
image

- Ah-Ong replied Aug 24, 2020
Yes, I also got the alert.
Daily Trading Strategy [ADR + RSI = High Probability] image
- Ah-Ong replied Aug 24, 2020
Same for me, I wait n1 to confirm.
Daily Trading Strategy [ADR + RSI = High Probability] image
- Ah-Ong replied Aug 11, 2020
Thanks for your source code.
Daily Trading Strategy [ADR + RSI = High Probability] I have made some changes as below. Now work perfectly. image change 2 to 1. or download the modified source code below. file

- Ah-Ong replied Aug 11, 2020
I adjust to match, but still the same, got gap.
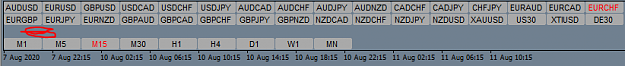
Daily Trading Strategy [ADR + RSI = High Probability] nvm, it's ok. image
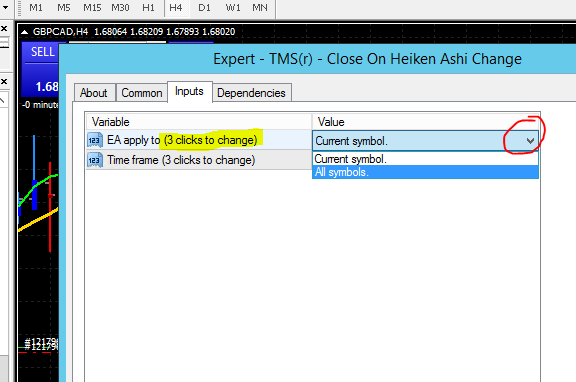
- Ah-Ong replied Aug 11, 2020
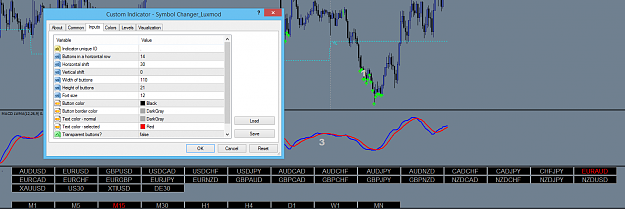
Hi Pip Bull, First, thank to your indicator. My chart shows that there is a gap between symbol and time frame button. how to make the time frame button close to the symbol without having a gap between them ?? image
Daily Trading Strategy [ADR + RSI = High Probability]
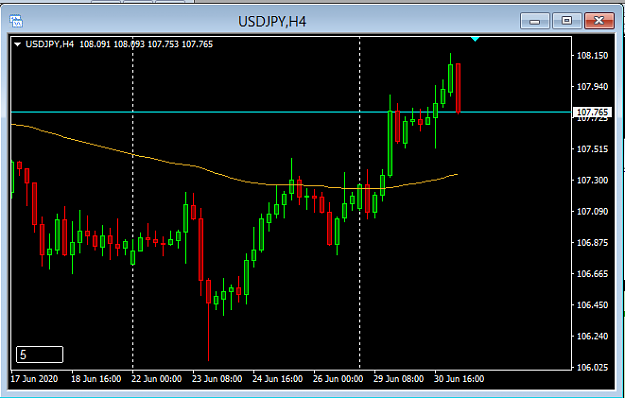
- Ah-Ong replied Jun 30, 2020
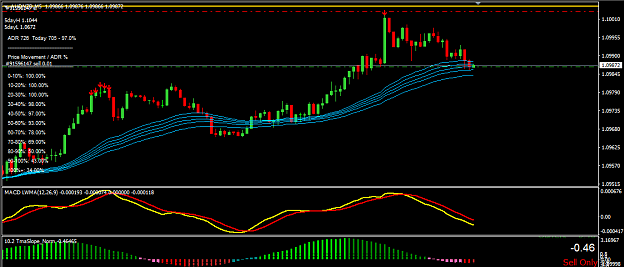
Hi Minotawr, you take as a watchlist by a clear trend in a bigger timeframe (H4) like below ?? image
Magic 100