- Search Forex Factory
- 6 Results
- 1colinfirst replied Aug 15, 2016
Attached is the current EURUSD H1 chart. It shows a reverse umbrella (called as the cup) being formed currently. Such formations usually break to the upperside, sooner or later.
Simple Trading Using Simple Techniques

- 1colinfirst replied Aug 15, 2016
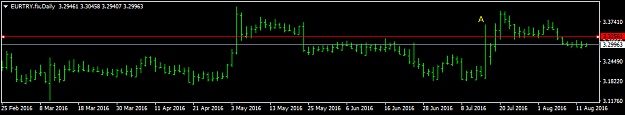
here is another fun way to find SR regions. This also shows how amazing charting can be. and it can be fun too ! I have just taken a chart at random. not handpicked them. i have posted a EURTRY daily chart. Look at the bar marked A. You see that the ...
Simple Trading Using Simple Techniques
- 1colinfirst replied Aug 15, 2016
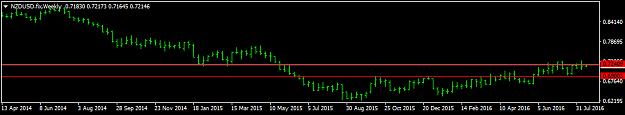
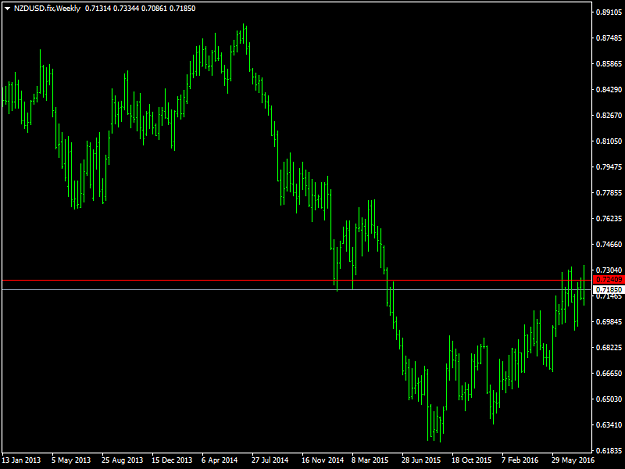
Thanks for your inputs to the thread. I have posted a weekly chart of NZDUSD again with my TP marked. Now, when you look at the weekly chart, you can see that the level has not been broken on the weekly as easily as it looks on the daily chart. In ...
Simple Trading Using Simple Techniques
- 1colinfirst replied Aug 14, 2016
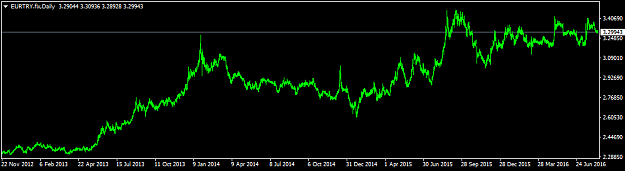
I have attached a daily chart of EURTRY just to show its long term trend, which has just been up and up and up. Look at where it was in 2013 and where it is now. No indicators, no price action. Just pick a spot, choose your trade size and go long. ...
Simple Trading Using Simple Techniques
- 1colinfirst replied Aug 14, 2016
Thanks Matraguna, for your comments. I really dont use Fibs nowadays as well. If you think about it, fibs are just another way to find the places of supports and resistances. And there are a hundred ways to skin the cat. We can find support and ...
Simple Trading Using Simple Techniques
- 1colinfirst replied Aug 14, 2016
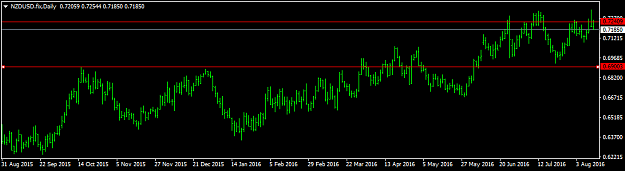
An example of a simple technique for a simple trade. See attached weekly chart of NZDUSD. It has hit resistance (marked by red line) and it has failed there. Being a weekly resistance, it is going to be tough to break. Add to this, the fundamental ...
Simple Trading Using Simple Techniques
- Posts by Member Search: '1colinfirst'