- Search Forex Factory
- 331 Results (4 Threads, 327 Replies)
-
 the_wizard replied Oct 21, 2015
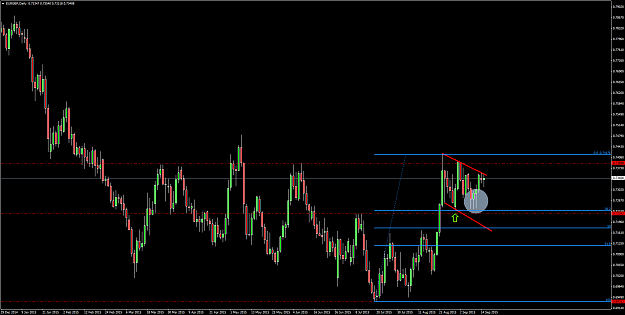
Hi Siamceltic, Sorry for the delay in responding. EUR/GBP The EUR/GBP trade was a decent enough level. However, I have attached a chart showing what I consider to be the last high pre-breakout on the H4 chart (0.7216) which is slightly lower than ...
Fail Better
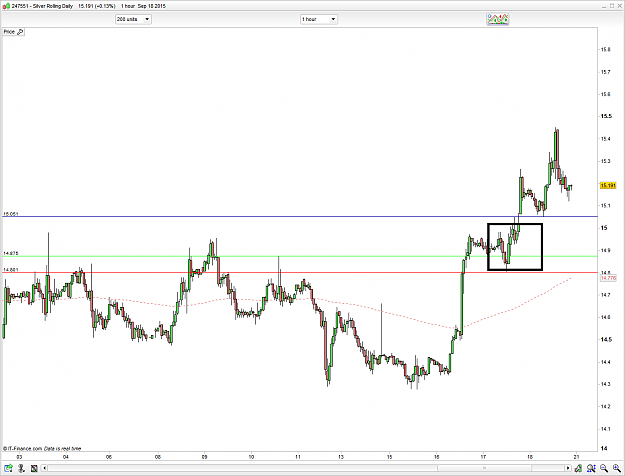
- the_wizard replied Sep 28, 2015
Hi Mark, Sorry for the late response but yes, that does qualify as a shooting star formation. Where these formations appear is vital. This one appeared at an excellent area of prior support lows that also offered confluence with the 61.8% Fibonacci ...
Fail Better
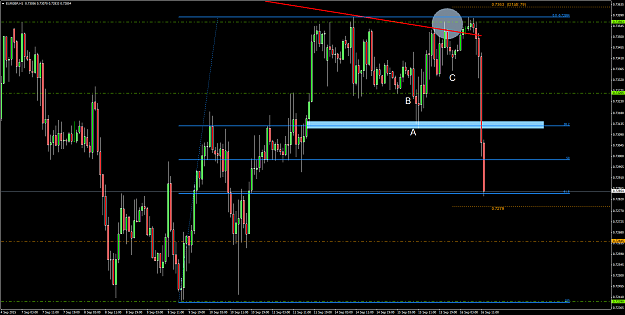
- the_wizard replied Sep 16, 2015
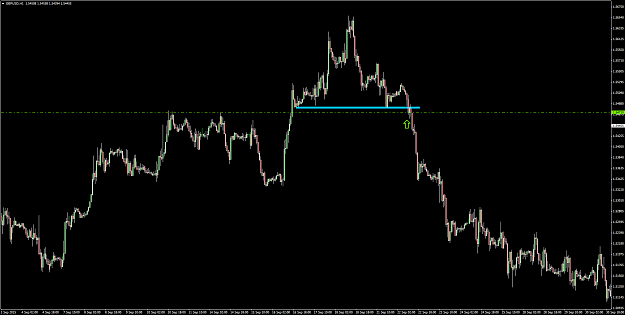
A quick update on the EUR/GBP that I posted yesterday. Note the importance of your entry when it comes to lack of follow through in the anticipated direction. If you entered at A (as discussed above) you have the option to take profit at the next ...
Fail Better
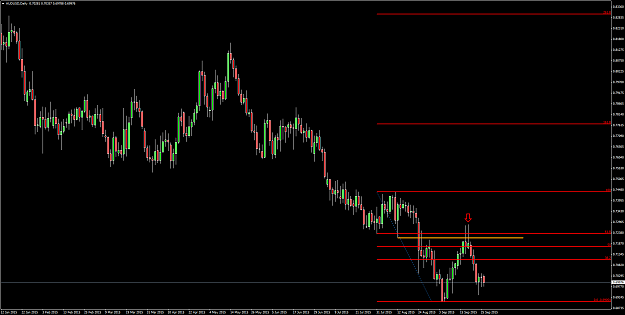
- the_wizard replied Sep 15, 2015
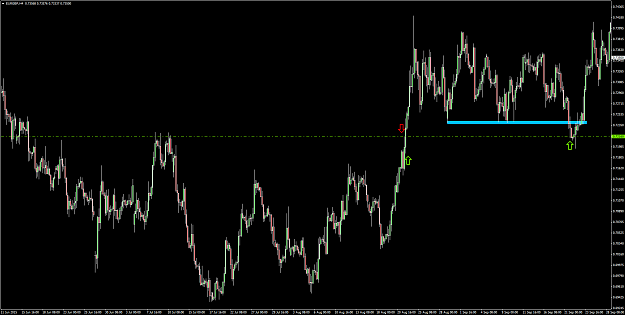
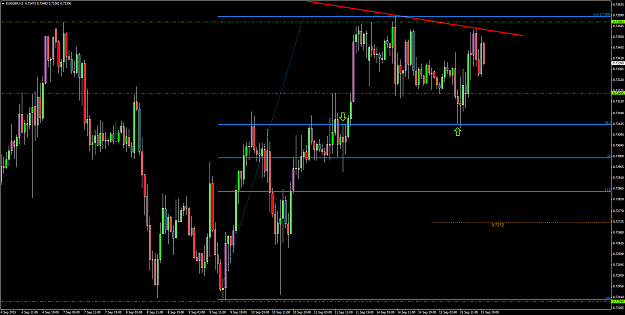
Now what I was ideally looking for was a quick drop into this area on Monday. In actual fact what you can see happened is that we based on Monday at the upper level (marked with the green arrows) but just couldn't find much strength there and it was ...
Fail Better
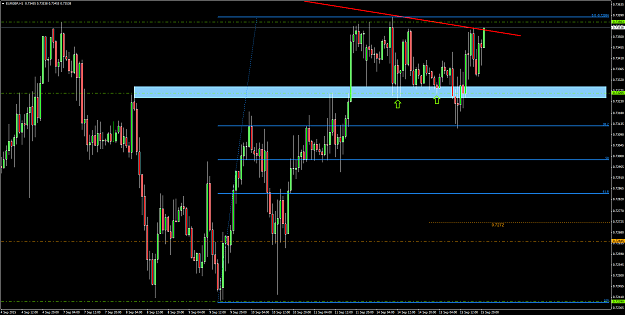
- the_wizard replied Sep 15, 2015
Coming down onto the 60m chart, we will see the former resistance level marked with the green horizontal line at 0.7326. This is the area that you wanted to be watching closely at the beginning of the week but the most precise entries are usually to ...
Fail Better
- the_wizard replied Sep 15, 2015
To refresh memories or to serve as an introduction to others, I thought I would post a setup from today. This is EUR/GBP - not a pair that I trade often or that I particularly like but this one allowed for a serious precision entry on the long side. ...
Fail Better
- the_wizard replied Dec 9, 2013
Hi Killerka, A few points to make. Firstly you have significant data missing from your D1 chart. (see mine below). This is an issue that you should take up with your broker. Regarding your trade, my interpretation of the opportunity differs from ...
Fail Better
- the_wizard replied Sep 24, 2013
To clarify: I sold on the SFP (marked with the orange down arrow / entry line marked in red). I cut as price broke the high of the candle marked with an orange down arrow. The taper move happened after (marked with the blue box) and there was a ...
Fail Better
- the_wizard replied Jun 11, 2013
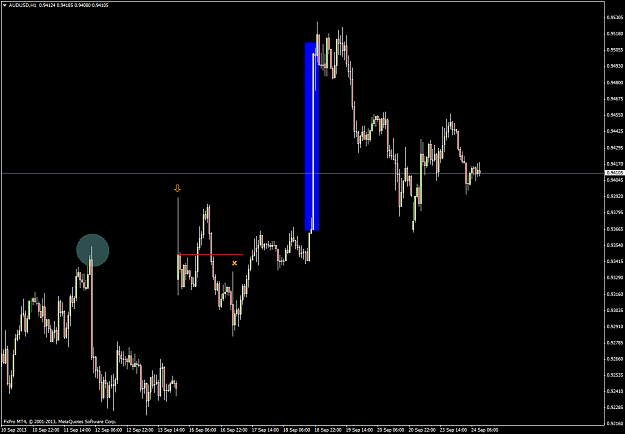
Just wanted to post a quick update on the setups discussed in the free strategy webinar on Sunday. First up was the Aussie. image We were looking for an H1 SFP of the 0.9386 level which is a weekly swing low that you can see in the chart above. On ...
Fail Better
- the_wizard replied Jun 4, 2013
It was the last high pre-breakout of the range. Price often finds its way back here.
Fail Better
- the_wizard replied May 31, 2013
This is the H1 chart. The blue zone is the logical place to sell blind (marked with the tick). The stop goes above the thrust candle that broke this level (marked with the red dashed line). Why the blue zone? - It is previous support lows (marked ...
Fail Better
- the_wizard replied May 31, 2013
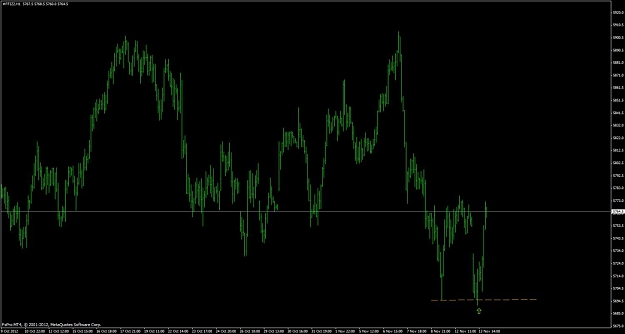
The daily timeframe exhibited the classic "day bias" ; the infamous "pin bar". We expect the market to move lower . The FTA is the purple dashed line at 6479 (enhanced by the D1 and W1 bearish action) Now many traders are taught to place sell stops ...
Fail Better
- the_wizard replied May 31, 2013
Let's keep this simple. The weekly FTSE broke prior weekly highs (marked with the red line) and formed a cross bar (SFP and Pin). This is the first big clue that all is not well.
Fail Better
- the_wizard replied May 31, 2013
The NZD/USD H1 SFP from yesterday was a good setup. Here is how I saw it. The previous swing low is circled and the SFP (which is also a pin bar/hammer) is marked with a green arrow. The FTA to me is the blue boxed zone and I would usually offer at ...
Fail Better
- the_wizard replied Feb 12, 2013
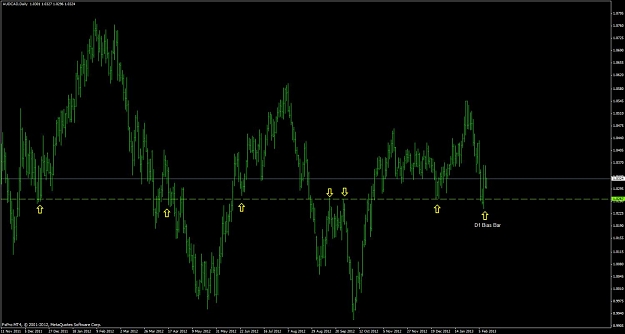
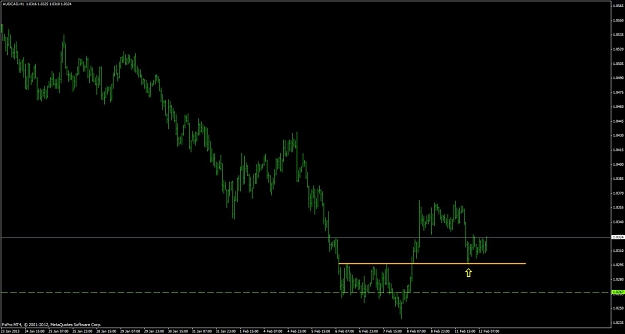
Another cross rate as I know so many of you look at them. First chart shows the D1 bias from the S/R pivot. Second chart (H1) shows the entry on the pullback, with space, into prior H1 resistance. The market has already traded into the H1 FTA on ...
Fail Better
- the_wizard replied Dec 10, 2012
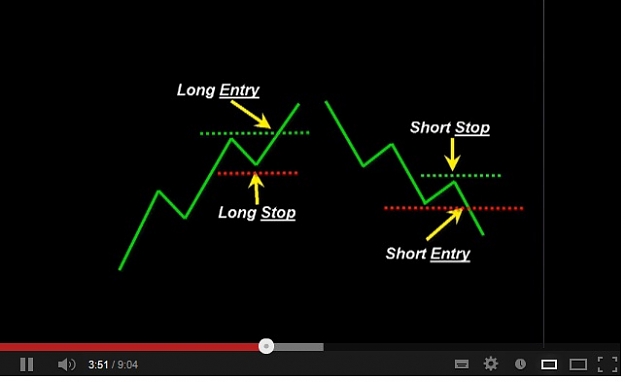
Second still of the "indicator". My annotations marked with question marks.
Fail Better
- the_wizard replied Dec 10, 2012
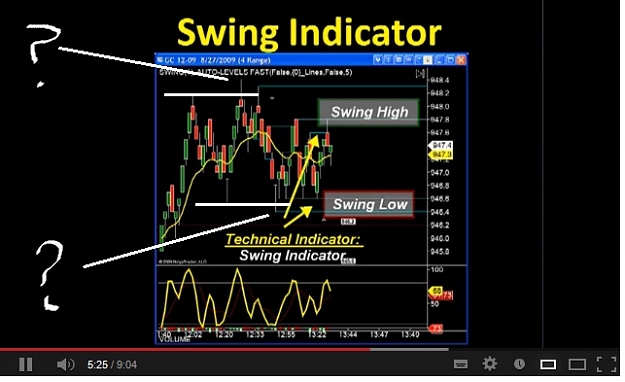
Some stills from a trading video on YouTube from School of Trade. Interesting.
Fail Better
- the_wizard replied Nov 21, 2012
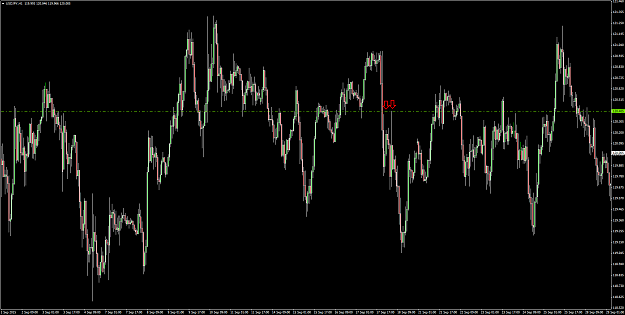
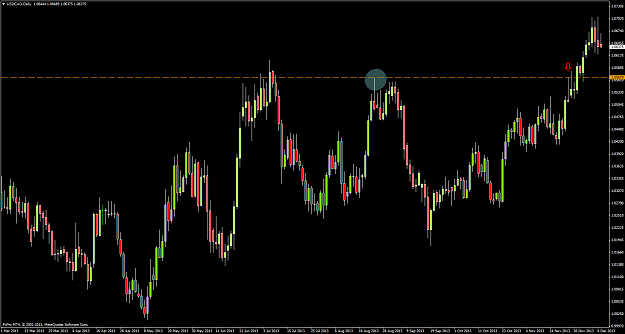
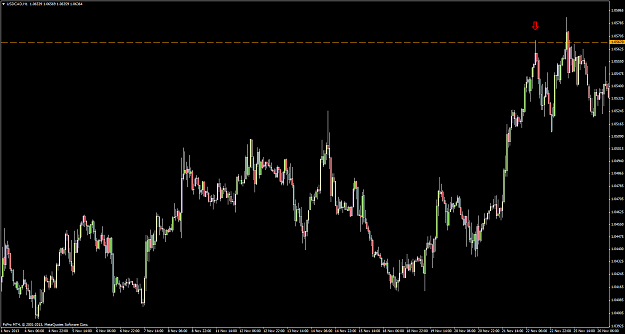
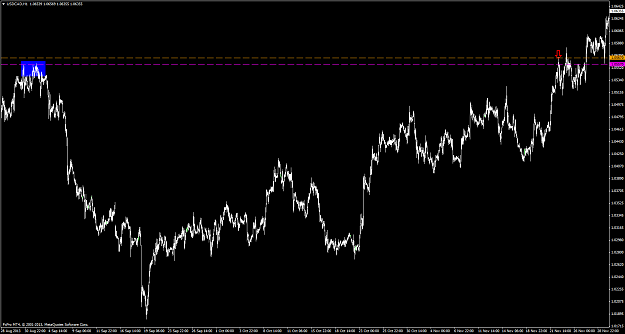
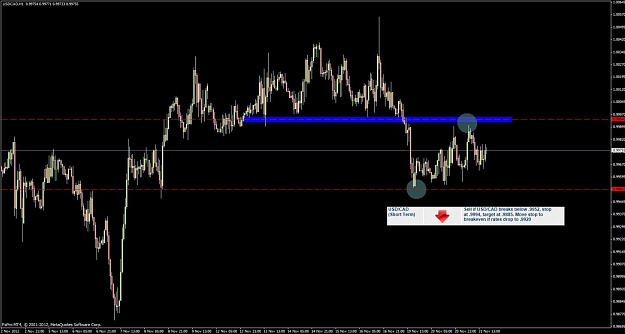
Here is their next trade (see below) Pending order in USD/CAD. Entry on break of swing low (look at the support there) Stop above swing high (note the former support they are stopping out into).
Fail Better
- the_wizard replied Nov 21, 2012
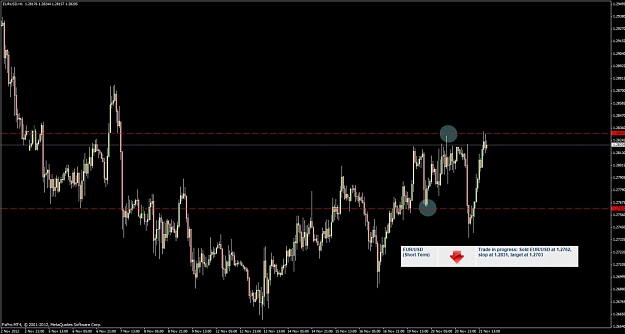
Check this analysis out from a popular currency strategist with thousands of followers on Twitter. That is a EUR/USD trade. Sold on break of swing low. Stop on break of swing high. (Stops in red). Result surprising?
Fail Better
- the_wizard replied Nov 13, 2012
And again today in the FTSE 100. You won't find this setup fail very often.
Fail Better