- Search Forex Factory
- 38 Results
- nico28 replied Apr 30, 2012
trix & renko — I am able to get the charts on GU, EU & EJ correctly except AU. The Trix indicator look very funny, flat ......... And I do not have the renko chart as well on AU. an anyone help out ? Thanks.
RENKO system with Mihailo!
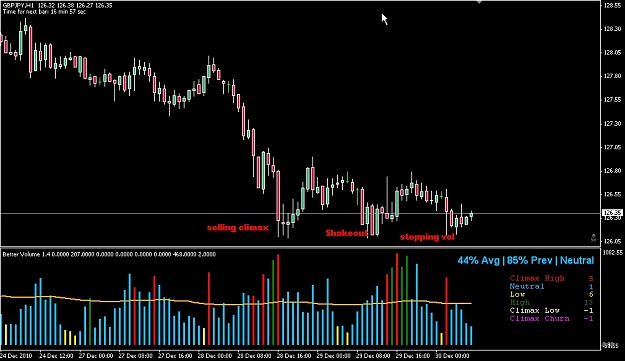
- nico28 replied Dec 30, 2010
is this strength in the background — I have post a H1 on GBPJPY. Though this can attribute to strength in the background. Question is when to enter, the hull in h1 is red, do we wait for hull to turn green in h1 before looking for test bar ...
vsa with Malcolm
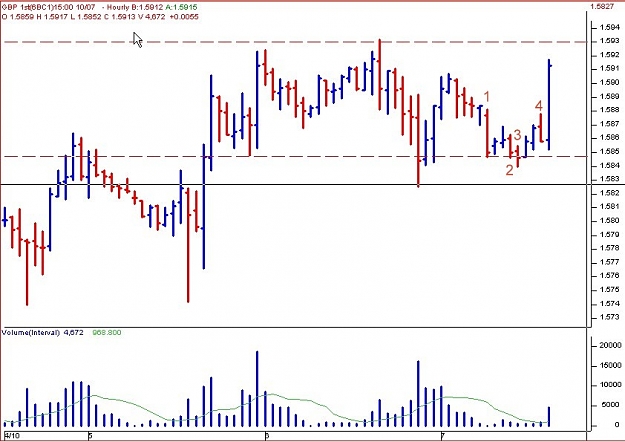
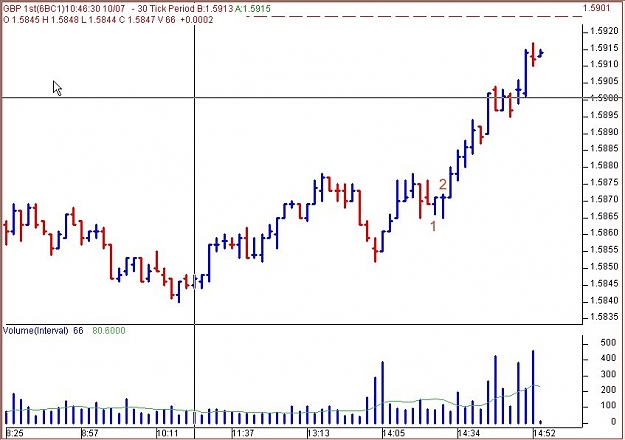
- nico28 replied Oct 7, 2010
Unless you pay and subscribe to software, such as esignal or nanija trader etc... and many more availabe in the market which are chargable. I have tried esignal and it is not cheap, so i switch to a low cost software which also offer me the S&P, DOW ...
vsa with Malcolm
- nico28 replied Mar 11, 2010
Is that End Of Rising Mkt ? Price after made a rally & retrace and few no demand bars show up. Short after the No Demand bars. Looking forward to any comments, tks.
Trade Using VSA (Volume Spread Analysis)
- nico28 replied Mar 5, 2010
Hi HG, Attached pls find AUDCHF D1 TF. Look like a End of Rising market with weakness shown all over at the top. Go to H4 TF, There is a ND bar with low vol. Sell the low of ND bar. Welcome anyone to comment on this analysis. Tks
Trade Using VSA (Volume Spread Analysis)
- nico28 replied Mar 3, 2010
EURUSD — Current price at uppen trend line. Look for opp to short. In M5 Tf, price re-visited the last high volume level. Price making higher high while volume is making lower high. Will short if a ND bar show up. Any comment ?
Trade Using VSA (Volume Spread Analysis)
- nico28 replied Mar 3, 2010
tks HG, Here is the H1 TF. Seen like 9100 is a resistance. Price went there 3 times & get rejected. With the D1 chart, I fig. mkt has entered into distribution phase & background is weak. Especially after 3 attempt for 9100 & failed. I plan to short ...
Trade Using VSA (Volume Spread Analysis)
- nico28 replied Mar 3, 2010
Hi HG, thankyou. Could you correct me if i wrong with this analysis on EURGBP. A wide bar where closed at the middle = SM is selling = Weakness the 2 more bars on the left lock out some weak hands = Weakness wait for no demand bar to sell .
Trade Using VSA (Volume Spread Analysis)
- nico28 replied Mar 2, 2010
thankyou hg for your reply. i have another chart on GBPCHF 30min TF. On the left, i believe its a Stopping Volume. On the right, the market went sideway, and all those marked in vertical red, i believe are the test. Question is : Are there any ...
Trade Using VSA (Volume Spread Analysis)
- nico28 replied Mar 2, 2010
Hi, Looking at EU M15TF. Can anyone cfm if that candle down is a Stopping Volume ? And few candles later, there are 2 bearish candles with low volume, are these 2 consider as Test ?
Trade Using VSA (Volume Spread Analysis)
- nico28 replied Mar 2, 2010
hi, IMO, I think GU is weak in a down trend. The price bar highligh in blue show SM is stepping into the picture to buy from the weak hands. Market has been in bearish run for GU, we may see SM start to accumulate. I would like to wait for a test on ...
Trade Using VSA (Volume Spread Analysis)
- nico28 replied Mar 2, 2010
USDJPY — DOUBLE TOP = RESISTANCE 8940 Price move up while volume is reducing. Don't think price can take out 8940. Look to sell as high as 8940. Question I have is when to know to sell ? Any specific price bar pattern to look for ? Any ...
Trade Using VSA (Volume Spread Analysis)
- nico28 replied Feb 16, 2010
markup distribution — EURUSD H1 has show wide up bar with high vol. The 3rd upbar saw SM start to sell to the retails. Now market went into sideway with low volume, I am confused, is market now in distribution phase ? Any comment pls.
Trade Using VSA (Volume Spread Analysis)
- nico28 replied Feb 16, 2010
is that a mix signal — I posted 2 difference time frame chart on GBPUSD. D1 show SM has push through the supply with wide spread bar A and high vol. So, do we consider those sideway mkt as "locked in traders" ? Or are those sideway movement = ...
Trade Using VSA (Volume Spread Analysis)
- nico28 replied Feb 14, 2010
is this consider a successful test — Hi VSA traders, I m new to VSA trading but have been a followers to this thread for weeks now. AUDUSD H1 timeframe. 12 Feb, price made a low with climax high volume, 4 hours later, price made a test with ...
Trade Using VSA (Volume Spread Analysis)
- nico28 replied Nov 12, 2009
Hi Bob, I am in EURAUD long at 1.61582. Now the price went against my position by 120 pip, and price is at the lower BB band with Red, blue & whie all below 15 line. My question is is this a good time to re-enter 2nd level ? Reasons to re-enter are ...
Nanningbob 4H trading system
- nico28 replied Oct 13, 2009
Are you looking for long on GU ? Both D1 & H4 show bearish cross of TS/KS and price are below the kumo, CS is below the price curve. Only H1 show a bullish crossed with price above the kumo and CS above the price curve. So if take the trade based on ...
Ichimoku forever
- nico28 replied Oct 5, 2009
Thankyou bob. ook like EZ is going to offer up an opportunity to long today .
Nanningbob 4H trading system