- Search Forex Factory
- 22 Results (1 Threads, 21 Replies)
- mksmith31 replied Nov 25, 2013
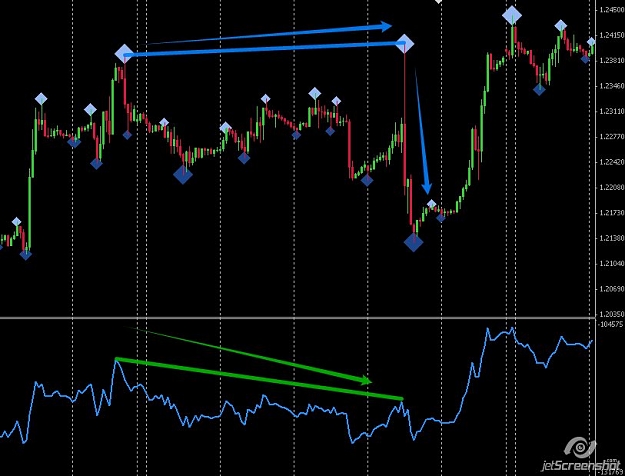
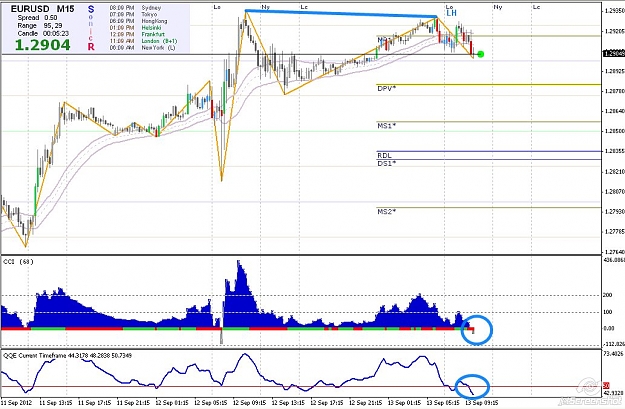
Well the concept of "out of sync" or divergence is pretty solid. I have been waiting for the Stochastic to hit 0 or 100, wait for a retracement, and price shoots to a new high or low with the stochastic coming back to 0 or 100. See the example ...
The 3-plan
- mksmith31 replied Nov 22, 2013
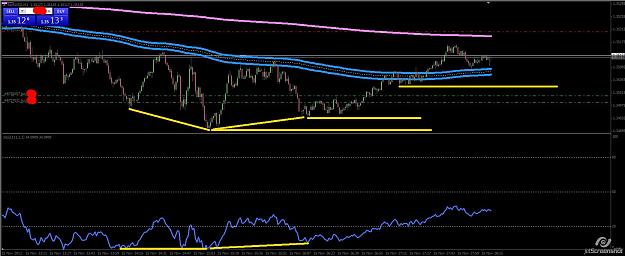
I am guessing this is what EURUSDD means by out of sync. Hopefully he can shed some light! image
The 3-plan
- mksmith31 replied Nov 22, 2013
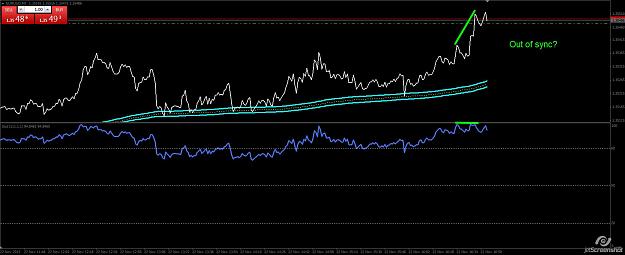
This is pretty amazing stuff. I saw NZDUSD out of sync last night and I am sitting +76 pips at the moment. Awesome job EURUSDD image
The 3-plan
- mksmith31 replied Jul 16, 2013
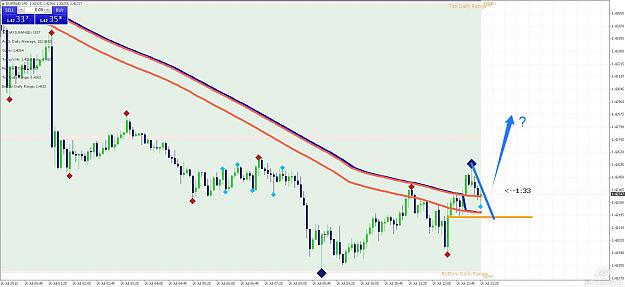
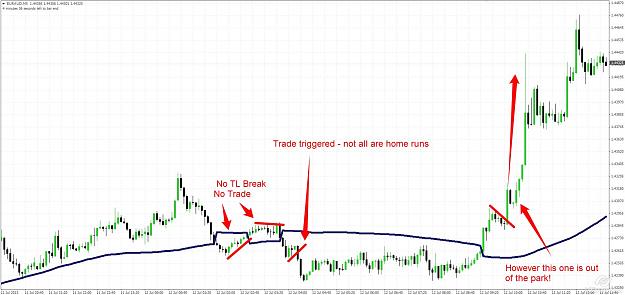
You most definitely could. You can re enter on any consolidation break but I would look for deeper consolidations as a time to put on the breaks and wait for the next move. image
Gann Hilo trading with Trendlines
- mksmith31 replied Jul 15, 2013
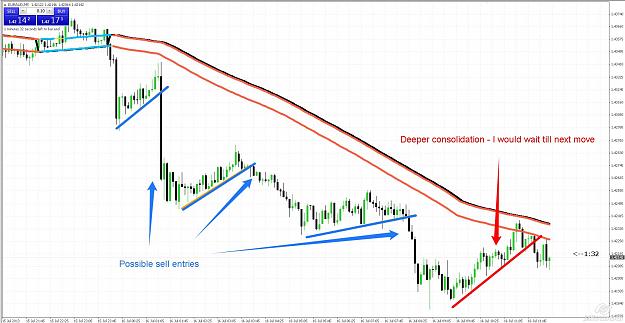
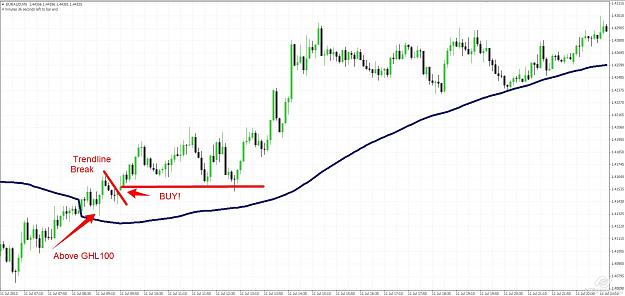
Here was some of today's action. I added two small items to the chart for illustration purposes. The channel is actually a SMA100 High and SMA100 Low - as that is how the Gann Hilo is calculated. However I used the indicator "allaverages" to add the ...
Gann Hilo trading with Trendlines
- mksmith31 replied Jul 14, 2013
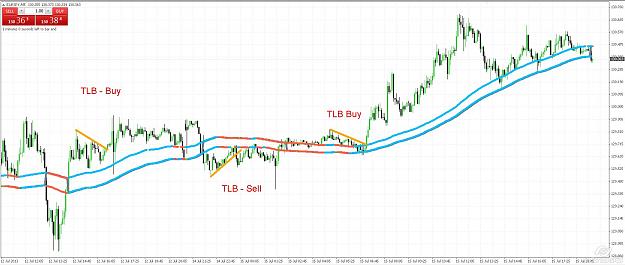
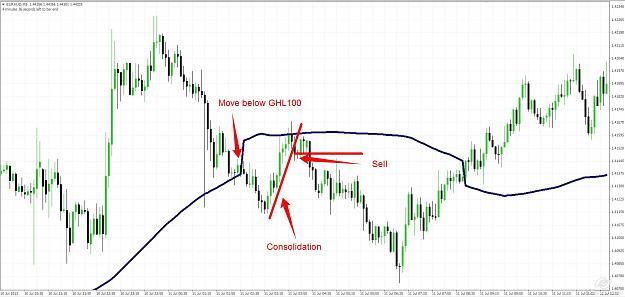
Indicators: GannHilo - Period 100 EJ Candle Time Buy: 1. Price moves above the GannHilo and candle closes 2. Price consolidates sideways or lower allowing for a trendline to be placed 3. If price breaks the trendline up while staying above the ...
Gann Hilo trading with Trendlines

- mksmith31 replied Sep 19, 2012
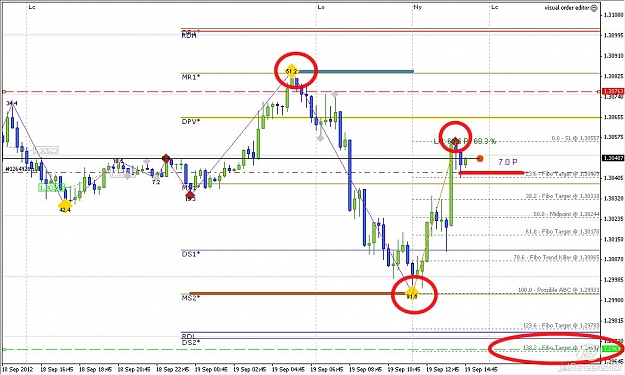
Just took this M15 trade - Good luck out there! image
Semafor Trend Trading
- mksmith31 replied Sep 17, 2012
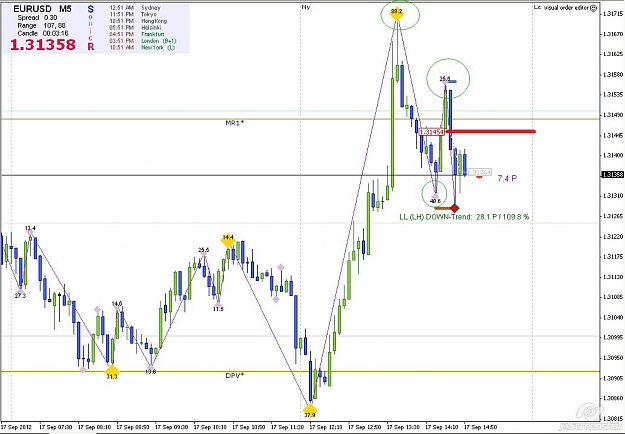
Turns out this could have been a quick 10 pip trade (or more). I decided not to take this one though (see above). image
Semafor Trend Trading
- mksmith31 replied Sep 17, 2012
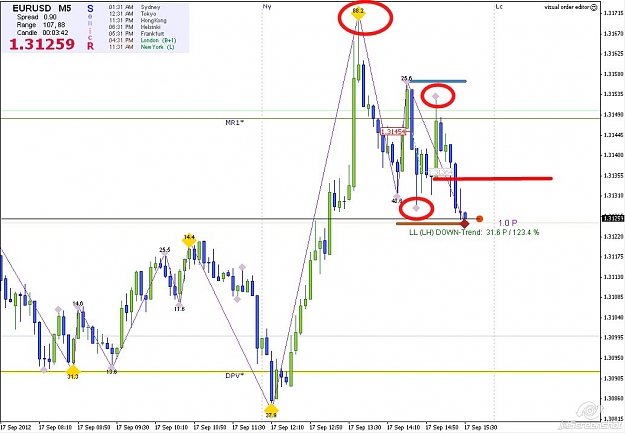
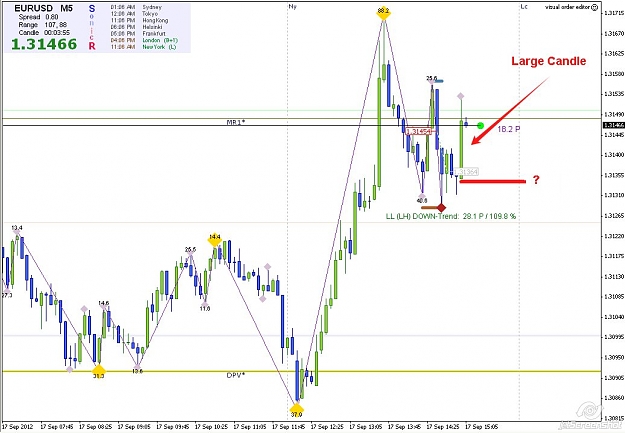
Here is an example of a large candle in action. We could take the sell as shown by the red line (as we have a lower high in place) but we are 18 pips from semafor to entry. With a medium semafor already on the bottom, I usually let these trades go. ...
Semafor Trend Trading
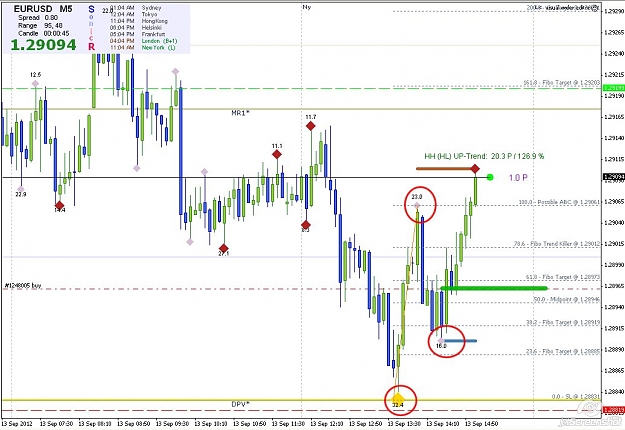
- mksmith31 replied Sep 17, 2012
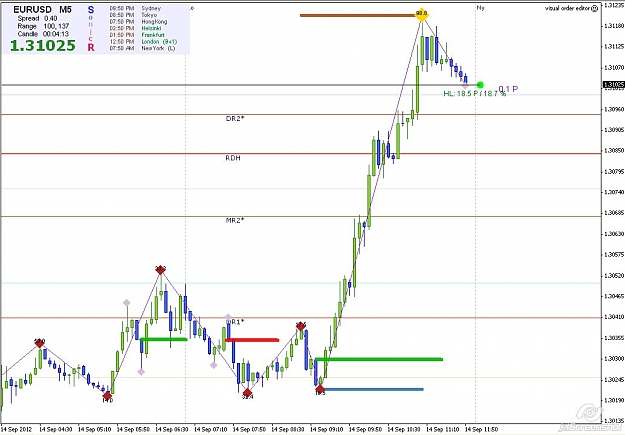
Just took a quick 9 pips. The trend is very strong to the upside but M5 showed us a little pullback. See below: image It is up to you how to manage your trade when you are in it. When I trade a small time frame (like M5) I like to see 8 or 9 pips ...
Semafor Trend Trading
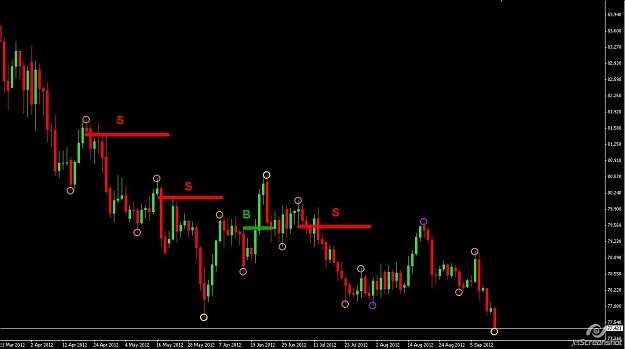
- mksmith31 replied Sep 15, 2012
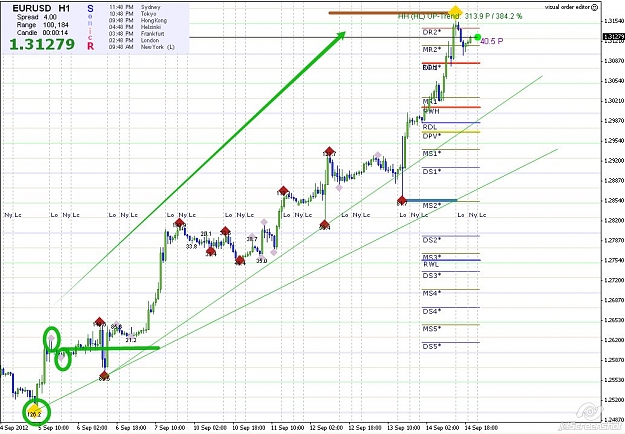
Here is a good longer term example (500+ pips possible): image
Semafor Trend Trading
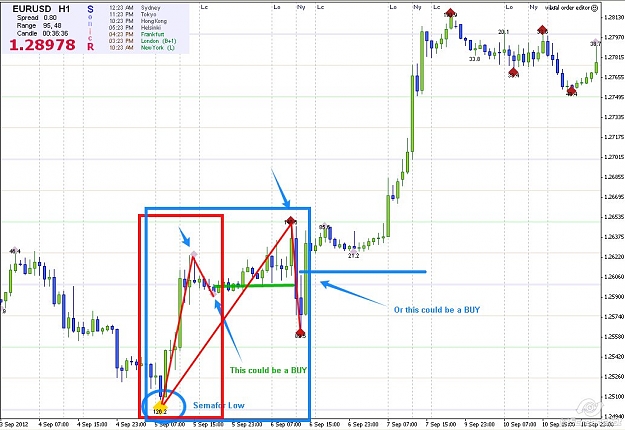
- mksmith31 replied Sep 14, 2012
London — Man I wish I lived in London. Lots of opportunities today! image
Semafor Trend Trading
- mksmith31 replied Sep 13, 2012
Asian session, you know what that means .. zzzzzzzzz
The gg53 "Killing Zone"
- mksmith31 replied Sep 13, 2012
Like this.. — My style would be something like this: image
Semafor Trend Trading
- mksmith31 replied Sep 13, 2012
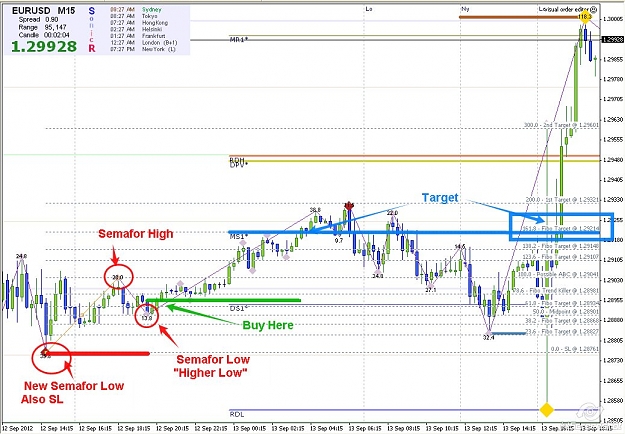
Buy Signal — This just presented itself on M5: image
Semafor Trend Trading
- Semafor Trend TradingStarted Sep 13, 2012|Trading Systems|86 replies
I am trader of about 7 years. I have been through many systems looking for the holy grail until I ...
- mksmith31 replied Sep 13, 2012
Euro — If today wasn't QE3 day i'd be all over this. Looks like a good Sonic setup! image
Sonic R. System
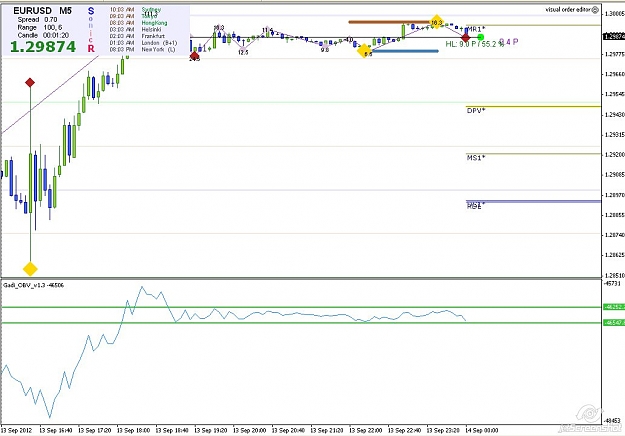
- mksmith31 replied Sep 11, 2012
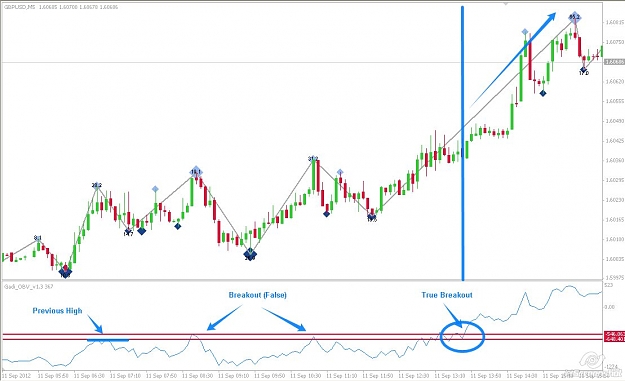
Anama, I think he is referring to the breakout on cable was (my volume = -648). The volume topped out at (-541) initially before going lower. It did this a second time and moved lower before actually moving higher and staying above. See attached. My ...
The gg53 "Killing Zone"
- mksmith31 replied Sep 7, 2012
Not sure about that .. — Not sure what you are looking at here. We have a higher price and higher Gadi which would mean no divergence. We would want to see a new high on price with a lower Gadi reading to give us bearish divergence. This is an ...
The gg53 "Killing Zone"