- Search Forex Factory
- 56 Results
- jcat replied Jul 16, 2021
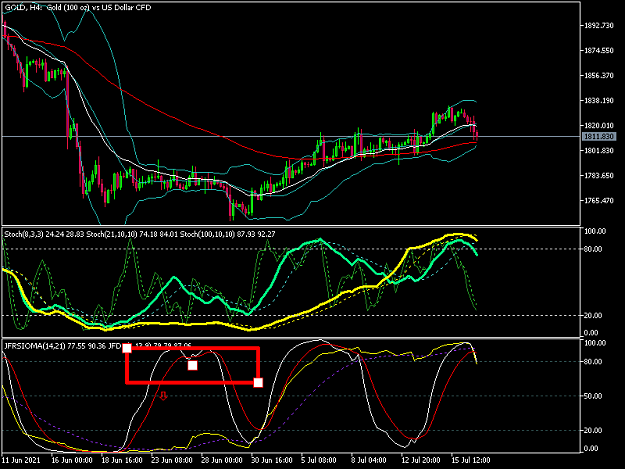
This what V1 looks like on the 4 hour. Your 4 hour chart prob had your 4h RSI was 0 line, just as the RSIOMA is buried below the 20. You have to pay attention to the upper time frames "RSI" the DDS is just showing you the pullback. See the ...
Alien's Extraterrestrial Visual Systems
- jcat replied Aug 15, 2018
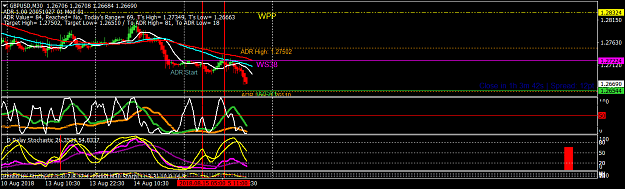
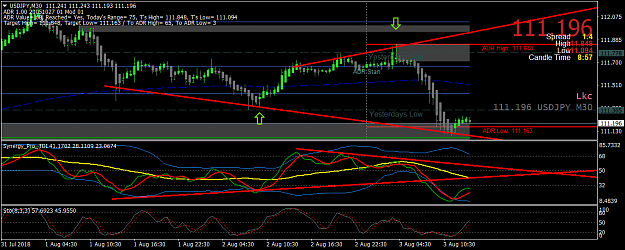
hindsight is always 20/20. Here is the 30 min chart of the GU. Price pulls back to the Pivot, doubles into it. and goes down. First red line is your entry. Def pips to be had. Waiting till London Open for the GDP crosses is usually better.
Alien's Extraterrestrial Visual Systems
- jcat replied Aug 6, 2018
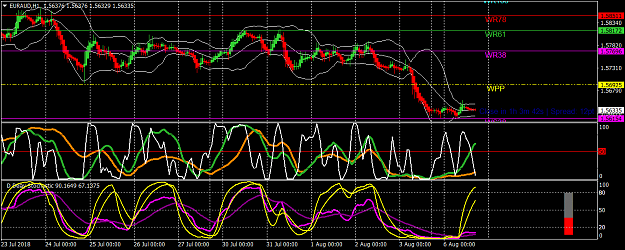
If you are new to the system you can get started by reading the first 9-10 pages. Then I suggest you reread them. That is a great start.... This is the current Eu/Aud, 1 hr chart, the bottom window is the yellow DDS, separated from the RISOMA which ...
Alien's Extraterrestrial Visual Systems
- jcat replied Aug 3, 2018
Looks like a trade at NY open yesterday and London open today.
TMS for M30 charts
- jcat replied Aug 3, 2018
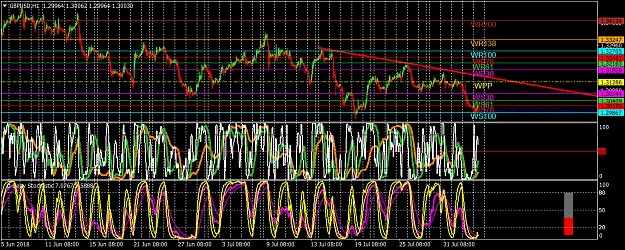
1 Hour builds the 4 hour, 4 hour builds the day. I don't see any rubberband, divergence, TTA ...anything on the 1 hour. That doesn't mean it won't go up You can the see the price ranging here, I think it will go up, but there are more interesting ...
Alien's Extraterrestrial Visual Systems
- jcat replied Sep 2, 2017
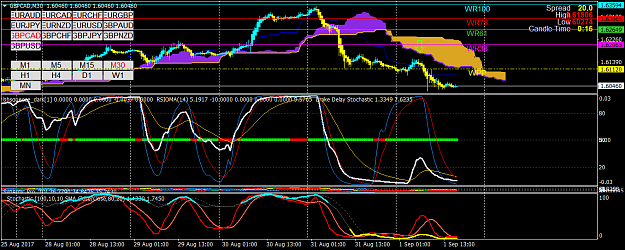
Right. There was over 100 pips total in the move. Plenty to capture. Also remember to check other TF. 30 min RISOMA never crosses 50. Still had the 20 Stoch Rubberband, and DS Divergence. Cloud settings are the default, yes, I use it for bias only. ...
Alien's Extraterrestrial Visual Systems
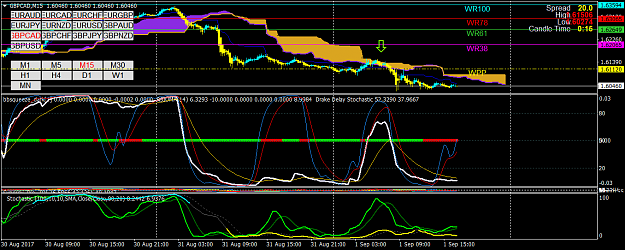
- jcat replied Sep 2, 2017
Just to give a pic, of what I was referring to with this. The 100 (Yellow color) stays buried as the RISOMA crosses up over the 50. If you were following the RISOMA and the 20 Stoch, you MIGHT be tempted to buy. 100/20 rubberband keeps you out of ...
Alien's Extraterrestrial Visual Systems
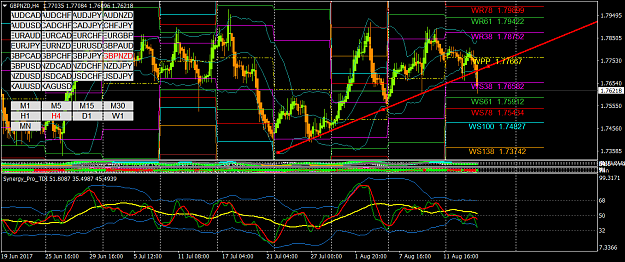
- jcat replied Aug 18, 2017
I wasn't asking for clarification, just pointing out both had broken their trendlines. They mirror each other. NU broke up, and has been in a range. EN, broke down, and in a range. Still very tradable, but just not a trend. I trade both, they mirror ...
TMS for M30 charts
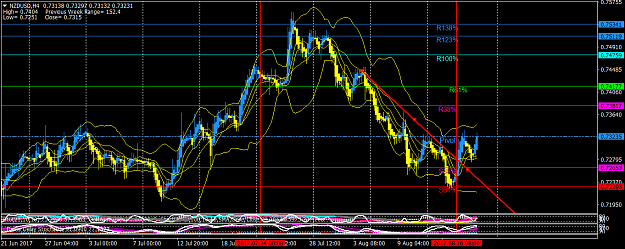
- jcat replied Aug 16, 2017
I think it and its "Reverse twin Sister" (GN) broke their trend lines ...end of the trend? Consolidation? Worth Paying attention to.
TMS for M30 charts
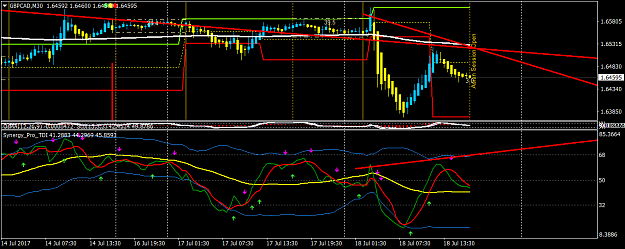
- jcat replied Jul 25, 2017
GCAD doubletopped into this area of resistance. (same place it turned around yesterday). Divergence Up 20 pips, taking half at 25 (if/when)...stop is at BE,
TMS for M30 charts
- jcat replied Jul 25, 2017
GJ. Yesterday had reg. divergence off a triple bottom. Today (too early and I missed it) had hidden divergence with a HL.
TMS for M30 charts
- jcat replied Jul 25, 2017
GJ had it's triple bottom Friday, Sunday night, and then yesterday London Open, you can see regular divergence on the third tap. Today it made a HL with hidden divergence. I would never trade off an oscillator, but using it to confirm Price Action ...
GBP/AUD, GBP/CAD, GBP/CHF and GBP/NZD thread
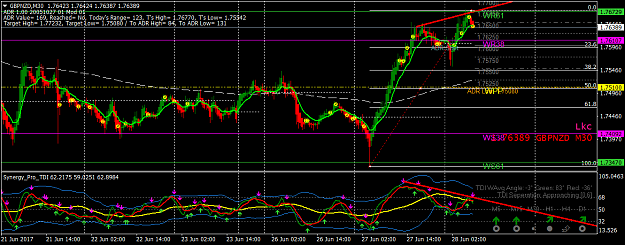
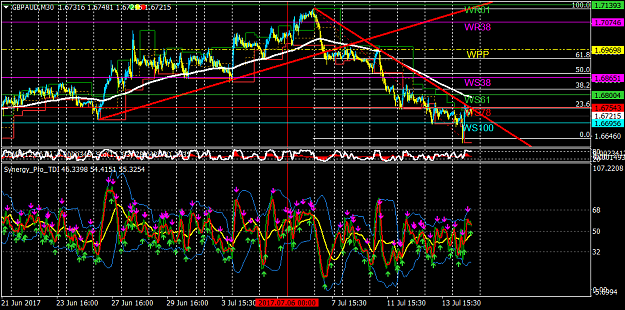
- jcat replied Jul 25, 2017
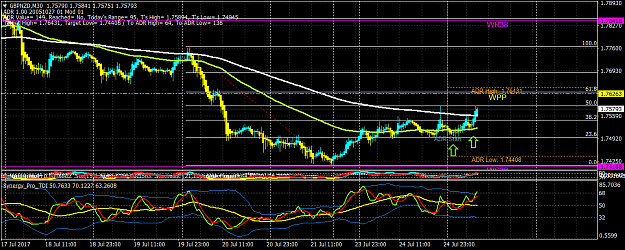
GN had a triple bottom on the 23 Fib. Then it made a higher low. Locked in 25 pips, have a trailing stop, targeting the ADR high. The TDI also showed divergence which confirmed the price action. (I meant I took half profit at 26 pips, put on the TS)
GBP/AUD, GBP/CAD, GBP/CHF and GBP/NZD thread
- jcat replied Jul 21, 2017
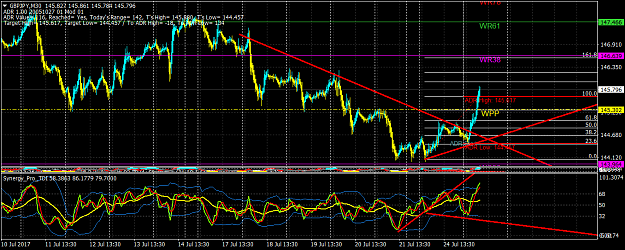
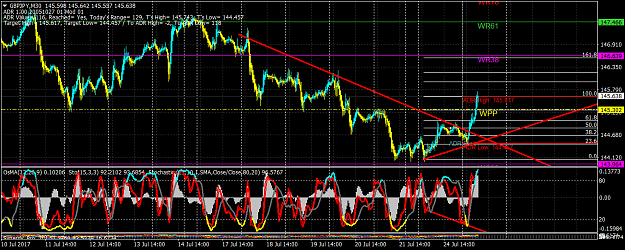
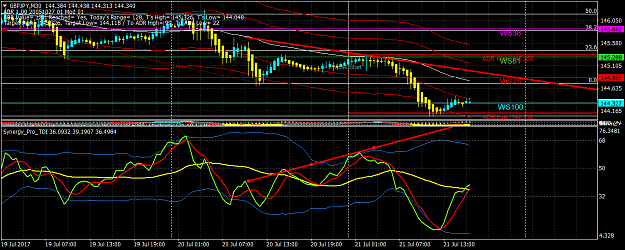
GJ-Divergence at Fib 23 (standard profit taking), and WS61
TMS for M30 charts
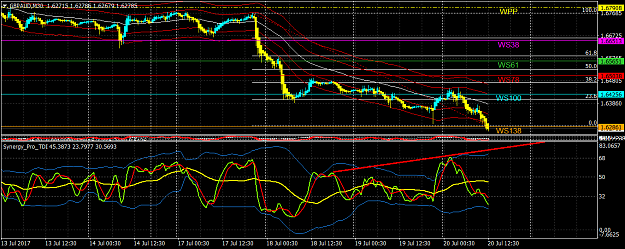
- jcat replied Jul 20, 2017
GA Divergence, I messed up with my take profit, could have gotten quite a few more.
TMS for M30 charts
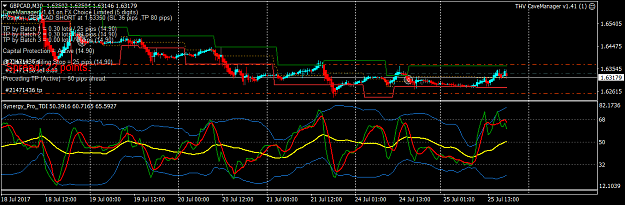
- jcat replied Jul 18, 2017
GCAD. Divergence at the 200 EMA. Was a little worried over the time, but it popped for 45 pips.
TMS for M30 charts
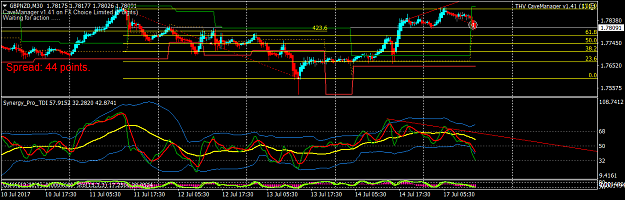
- jcat replied Jul 17, 2017
GN Divergence. Look Left this was a point of R. moved down, consolidated, I entered. Already took profit.
TMS for M30 charts
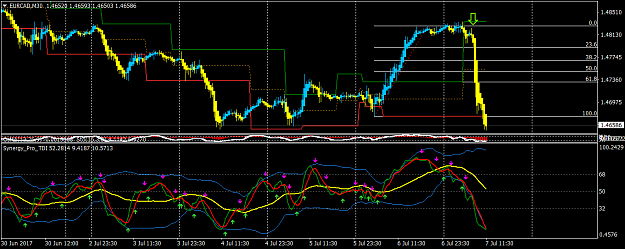
- jcat replied Jul 7, 2017
Sorry for the Fibs, this is Divergence, then price finally makes the LL/LH with the pin bar. I took profit at the 50 Retracement Line
TMS for M30 charts