- Search Forex Factory
- 15 Results
-
 exchange101 replied Feb 14, 2014
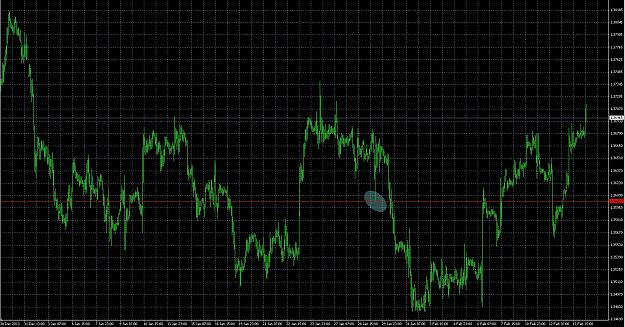
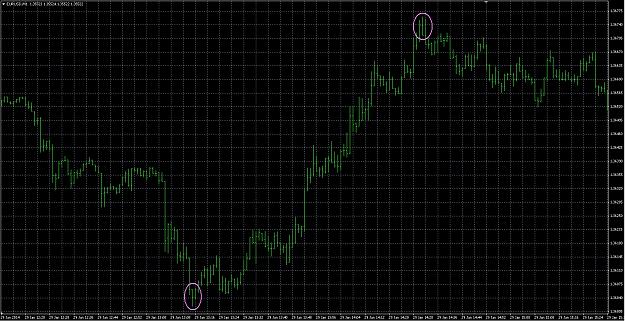
So, as Bring.M.Home stated, all the smoke and mirrors. WHY would anyone put a line there? Image below represents H1 chart. Red line is at the low indicated by me. Circled is the low. image
Professional Trading Strategy - student selection
- exchange101 replied Feb 8, 2014
This is a "map" of the forex market! What if you knew where you are in the market, price and time wise, at one moment and where you are heading!? image
Professional Trading Strategy - student selection
- exchange101 replied Feb 8, 2014
Let me show you something that at least 95% of traders say it can't be done or it doesn't exist! (EDIT: You won't achieve this with any indicator out there on the market, no matter how expensive it is) This is just a random small example. The ...
Professional Trading Strategy - student selection
- exchange101 replied Feb 7, 2014
The next image will be as a poll, sort of say. Please answer the questions even if you use indicators. Like I said in the beginning, it doesn't matter your knowledge level, just give your best shot. image Q1: Did you caught the big move? Y/N ...
Professional Trading Strategy - student selection
- exchange101 replied Feb 6, 2014
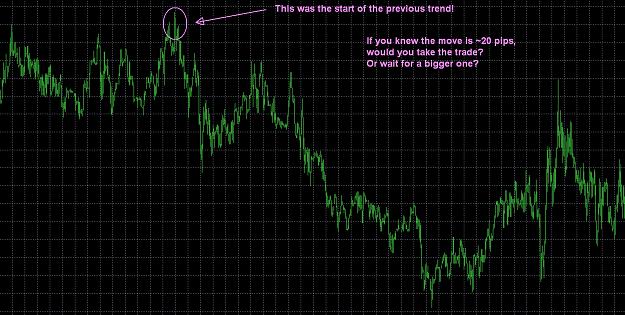
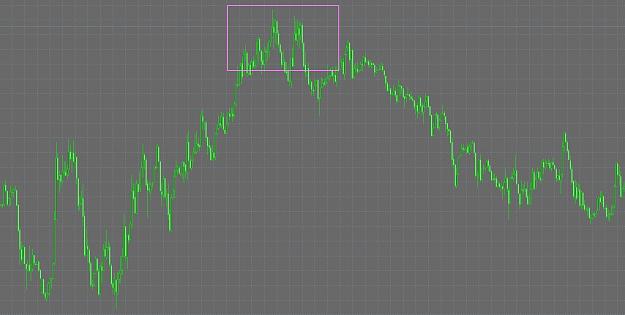
I have read all your posts, and I found a couple of quite 'nice' answers. The answer I was expecting was double top, as I know, at least some of you, are trading by patterns. No matter, your answers were quite clever and good. Let me show you now ...
Professional Trading Strategy - student selection
- exchange101 replied Feb 5, 2014
How about now? What does the image represent? image
Professional Trading Strategy - student selection
- exchange101 replied Feb 5, 2014
Many of you, use resistance and support, supply and demand zones. Z1p, with your permission I will use the image you posted previously. Referring to the redish rectangle drawn by z1p as an importance area. image WHY DOES RESISTANCE/SUPPORT WORK ...
Professional Trading Strategy - student selection
- exchange101 replied Jan 31, 2014
Strategy no 2 is a little more complicated as I said before, but it is rewarding. I can identify (mathematically) the points circled in the image below: image Haven't you wondered before how 'big players' and those extraordinary competitors in ...
Professional Trading Strategy - student selection
- exchange101 replied Jan 31, 2014
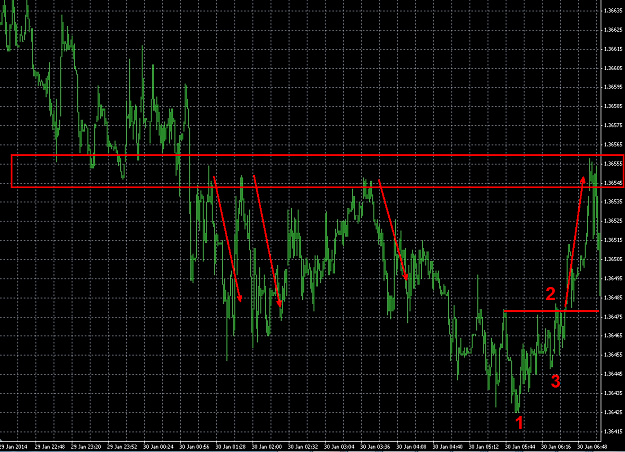
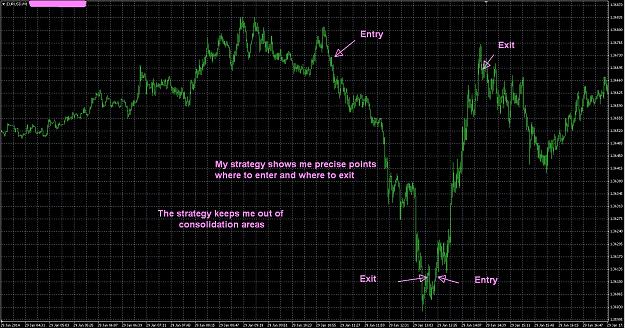
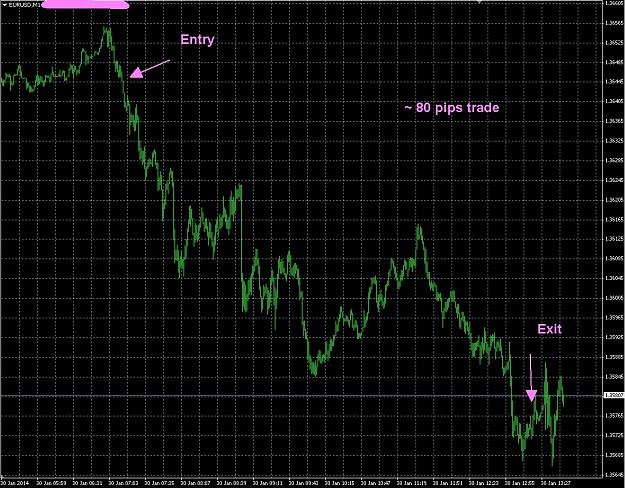
I have read all your entries and exits. I see they are based mostly on S/R, entry points and exit points keeps you from getting the most out of a trade. Look at the picture below, with my entry points and exit points: image
Professional Trading Strategy - student selection
- exchange101 replied Jan 30, 2014
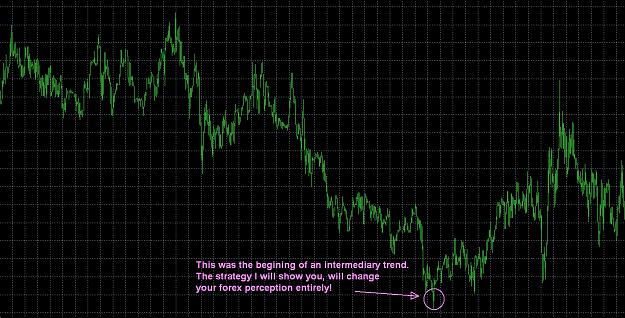
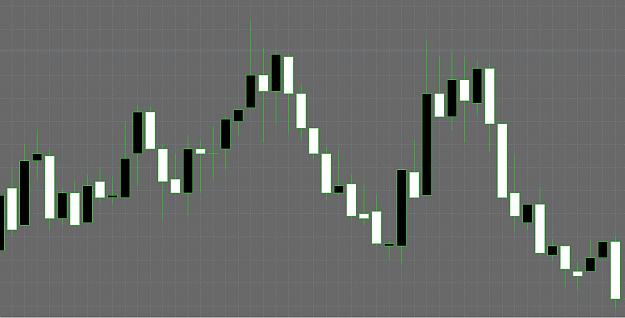
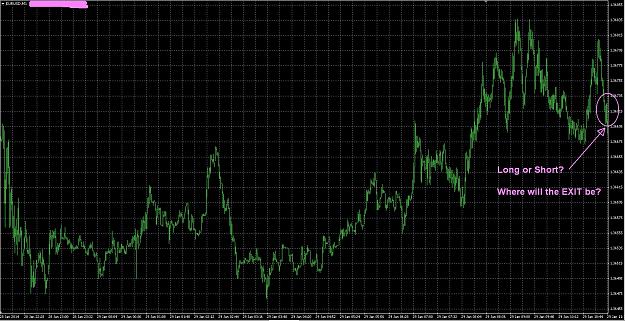
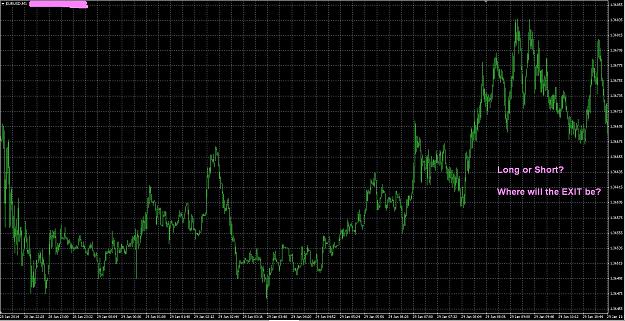
OK, maybe I wasn't clear enough and I apologize. Where will the price go from the end of the chart marked in the image below... think of the price in the circle as price at this moment....what will happen next? image
Professional Trading Strategy - student selection
- exchange101 replied Jan 30, 2014
I will give another example (very simple to help the newbies also). Don't cheat because it will not help you in real live trading. I just want to see how one is thinking on his/her own. Remember: by this examples I am trying to finish the first step ...
Professional Trading Strategy - student selection
- exchange101 replied Jan 30, 2014
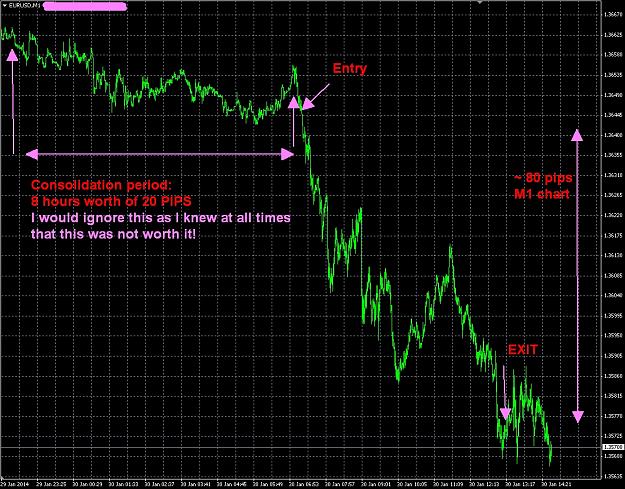
The above trade was a recent example. I use M1 because I like this. The strategies work the same and well from tick charts to daily charts, take your pick. I use it for M1 mostly and for higher TF when I don't have time or access to a computer. The ...
Professional Trading Strategy - student selection
- exchange101 replied Jan 30, 2014
Look at the image below. My trade for the day with strategy 1 (the simpler one). The image I have posted above.... I wouldn't have taken any of the trades triggered by S/R, indis, price action, you name it. I knew at all times that the market is in, ...
Professional Trading Strategy - student selection
- exchange101 replied Jan 30, 2014
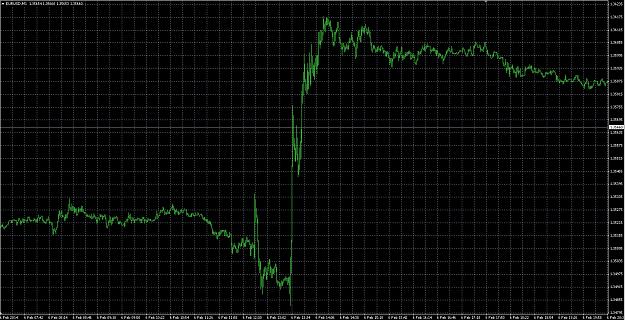
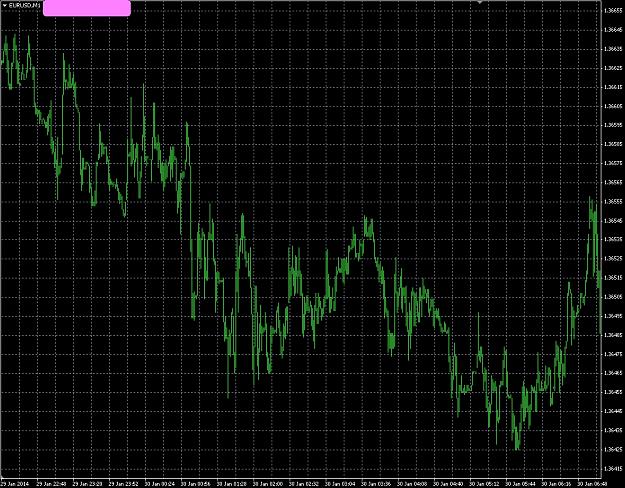
The image shown represents EU M1 from around 23.00 to 07.00 GMT+2, last night. Took this example as it was the most recent. Disregarding the hours and presuming this was during your trade hours, what would you have done? Where would your entry point ...
Professional Trading Strategy - student selection
- exchange101 replied Jan 23, 2014
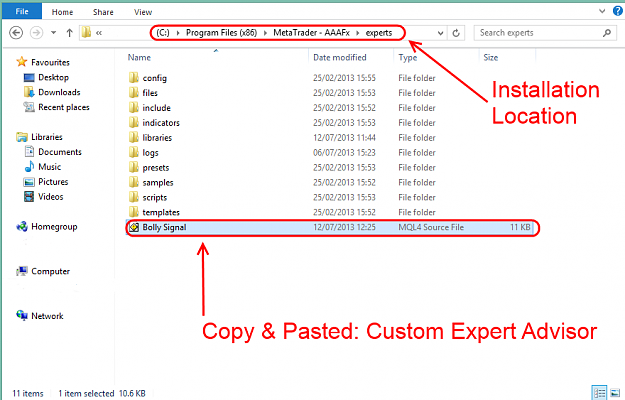
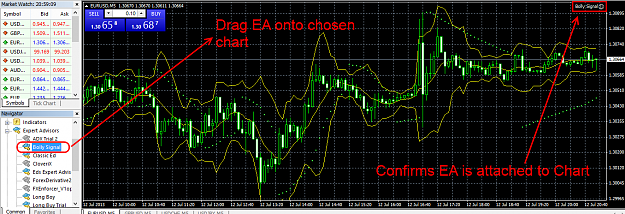
@rash10 Follow the next steps to install your EA: Transferring the File(s) image Either create or download an Expert Advisor. Make sure you make note of where you saved the relevant files. Select and Copy the files you need for installing your ...
Forex Demo Account Contests & EAs?

- Posts by Member Search: 'exchange101'