- Search Forex Factory
- 402 Results
-
 eohater replied Mar 19, 2010
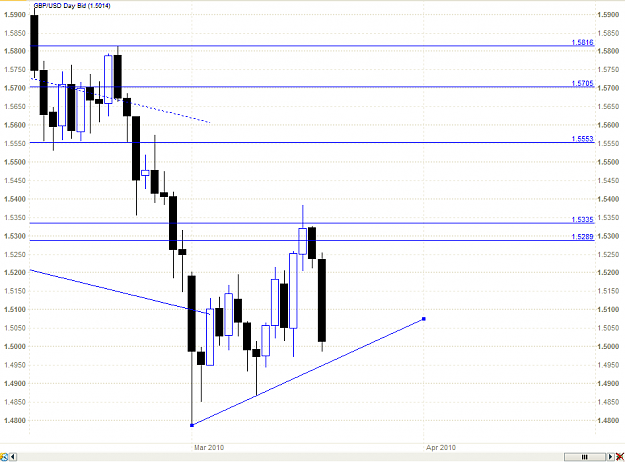
Daily, still not closed, but here's something everyone should be looking at.
Trade what you see NOT what you expect
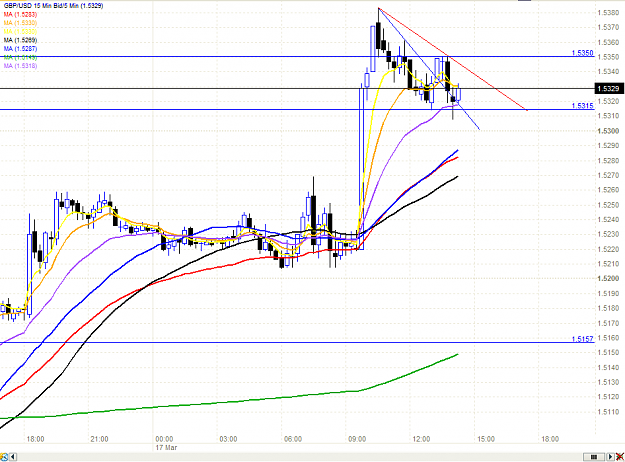
- eohater replied Mar 17, 2010
Watch the red descending trendline, I was referring to the blue one earlier about being on top. You can also see the range defined..
Trade what you see NOT what you expect
- eohater replied Mar 7, 2010
Brother Dak, I always appreciate your insight. I'm in line with your levels. I don't run fibs, but that nice to know they fall in line with us as well. I'm going to say one more thing, does anyone see the beginning of something that we have just ...
Trade what you see NOT what you expect
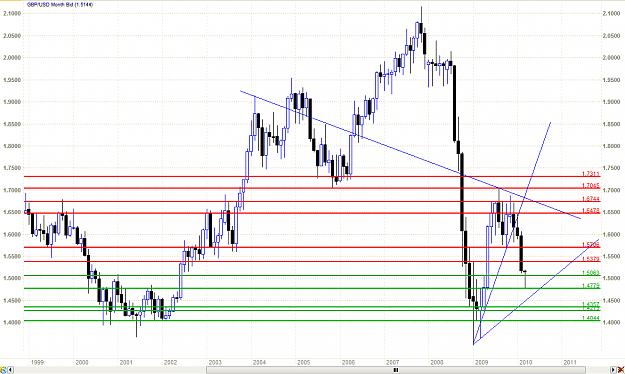
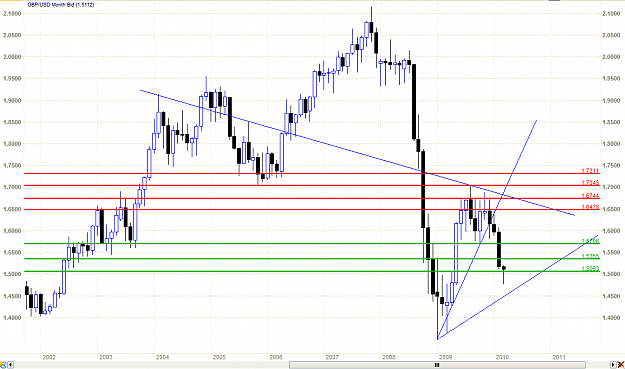
- eohater replied Mar 7, 2010
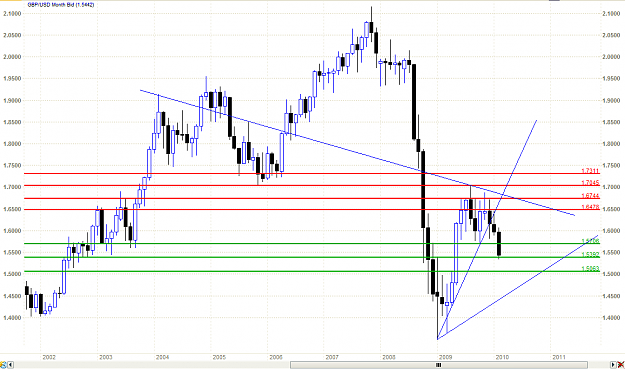
Here's my monthly. I've added some support and I've adjusted one prior support to be resistance. Your 4060 area is further down than what I see as our next level of support. Remember, this working candle is still just that, WORKING. I can go up just ...
Trade what you see NOT what you expect
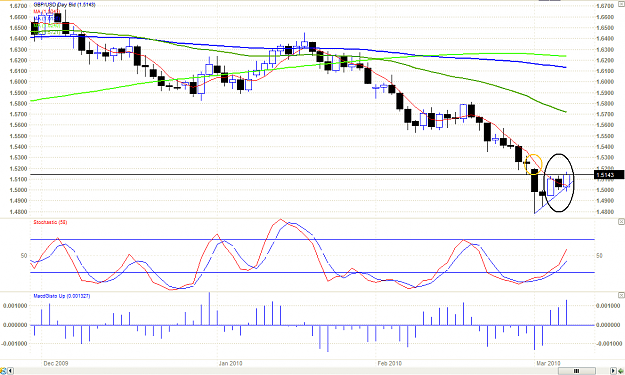
- eohater replied Mar 7, 2010
OK! Why did price do what it did on Friday. I made this post #32329 and only 1 person asked what I meant. This post was made after the first candle in the circled area closed. You can see on the 2nd candle, that price did go back down the towards ...
Trade what you see NOT what you expect
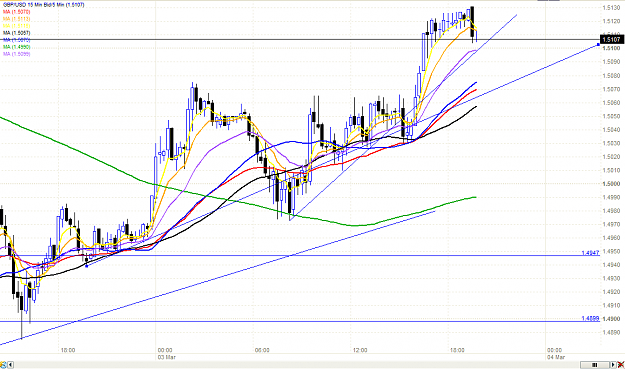
- eohater replied Mar 3, 2010
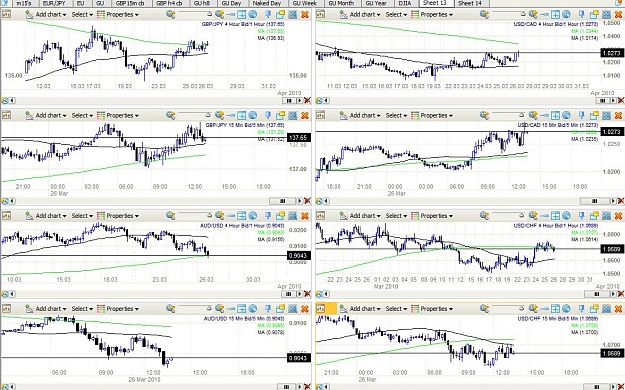
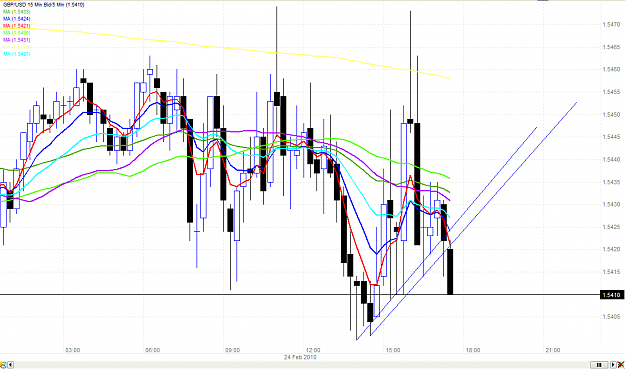
Possibly! Check out my working m15 chart and trendlines.
Trade what you see NOT what you expect
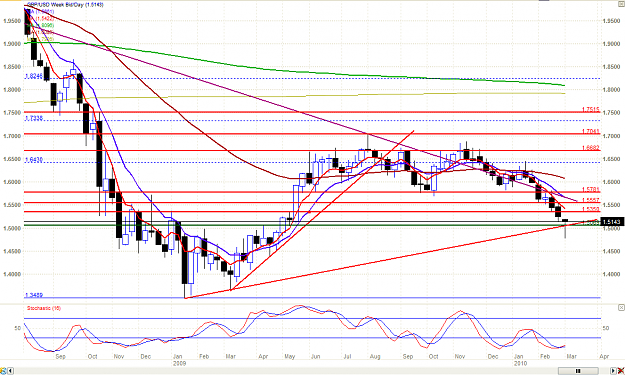
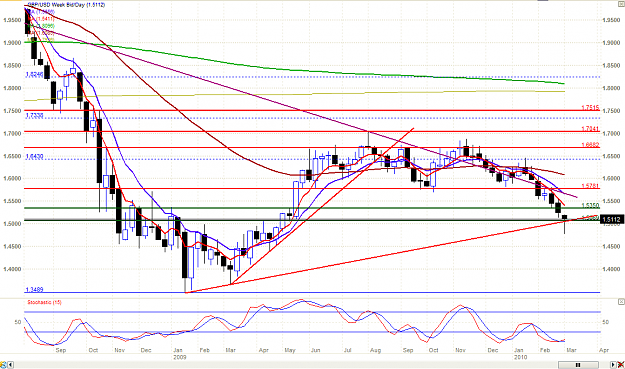
- eohater replied Mar 3, 2010
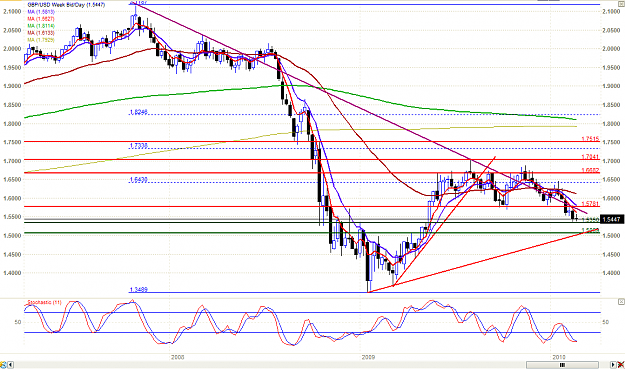
Here's my weekly. You can see the gap as well. I'm looking for it to get filled and I would like to see her close below the lower trendline that I have as well. If we do close below the lower trendline, I will be looking for my lower trendline on my ...
Trade what you see NOT what you expect
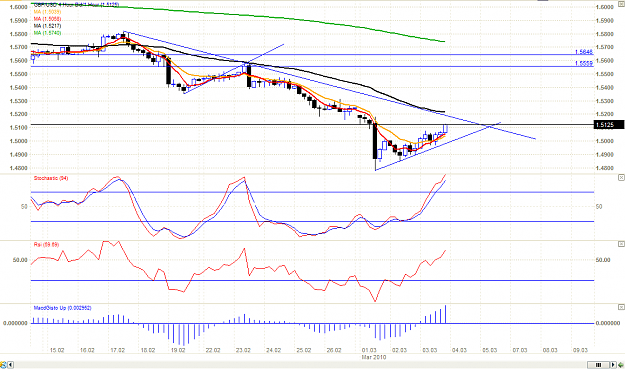
- eohater replied Mar 3, 2010
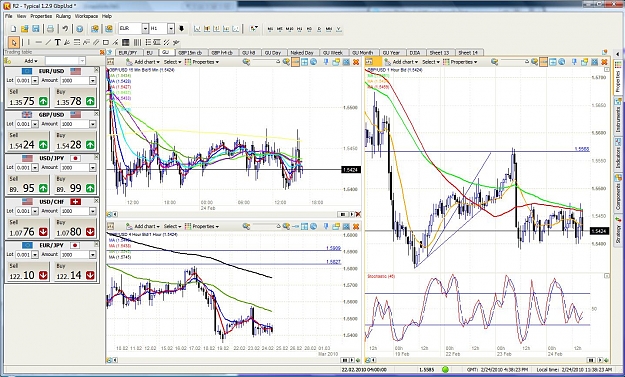
Here's my h4. You can see the bottom and top trendlines. I'm targeting the top with my longs to fill the gap then I'm looking for a smack down.
Trade what you see NOT what you expect
- eohater replied Feb 24, 2010
Welcome to the thread Lee! Congratulations on graduating from babypips! As to why I've chosen the ma's I have, it's just from trial and error. Remember what an ma is, nothing more than floating support and resistance. I've found the ones I use to ...
Trade what you see NOT what you expect
- eohater replied Feb 20, 2010
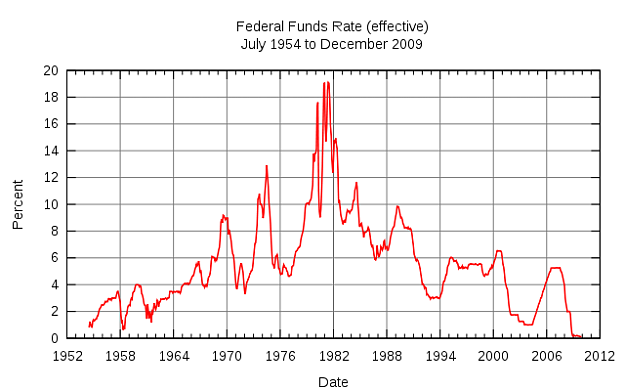
For those who want to worry about the Federal Funds rate and what it means. Here is a chart for you. You might also want to follow the link: url Now, this is what has me pissed off right now. Here is a quote: "Raising the federal funds rate will ...
Trade what you see NOT what you expect
- eohater replied Feb 9, 2010
Check this out. I drew some trendlines in RED.
Trade what you see NOT what you expect
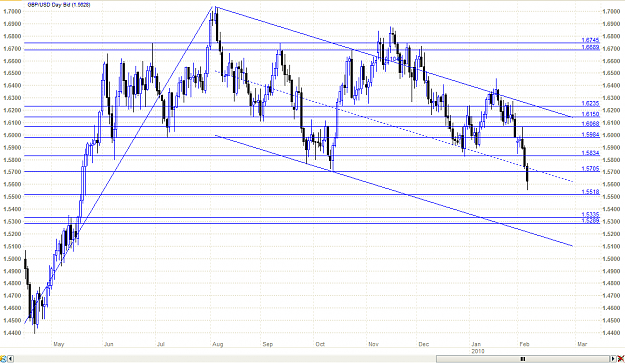
- eohater replied Feb 7, 2010
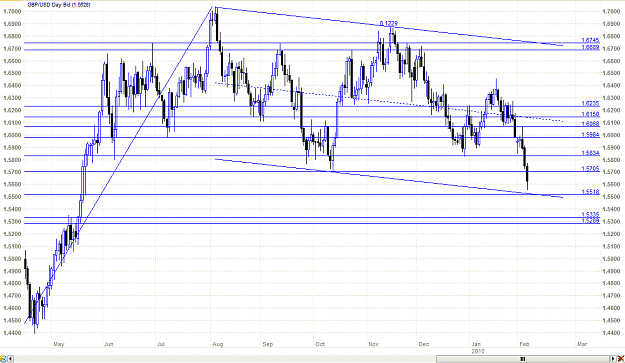
Here's my daily. I'm going to show 2 views of my daily with different channels. The S/R is the same on both charts. On my first daily, I show the bottom of a channel at 551x. Notice how the channel is flatter than the channel on my 2nd daily chart. ...
Trade what you see NOT what you expect
- eohater replied Feb 7, 2010
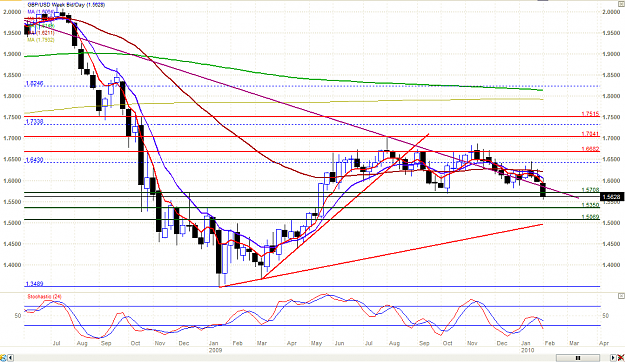
Here's my weekly. We closed the weekly with a bearish full bodied candle which keeps us on track for a further bearish move. We closed under the wick of the weekly candle from back the week of the 12th Oct 2009. Next stop shows me 535x. Now, this ...
Trade what you see NOT what you expect