- Search Forex Factory
- 20 Results

-
 billflet replied Nov 9, 2010
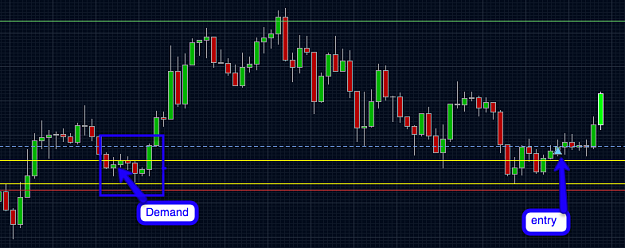
Nice analysis. I remember you saying that you found "cutting through candles" useful, not for entries, but for identifying prior supply and demand. Is that what you used to trail your stop?
Trading Supply & Demand Zones

- billflet replied Oct 15, 2010
If you watch the "Live Trading and Analysis" video, he talks about it at around 10 minutes in. In his example, when plotting supply, he used the top of the wicks for the top line and the lower candle bodies for the bottom line. Plotting demand would ...
Trading Supply & Demand Zones
- billflet replied Sep 26, 2010
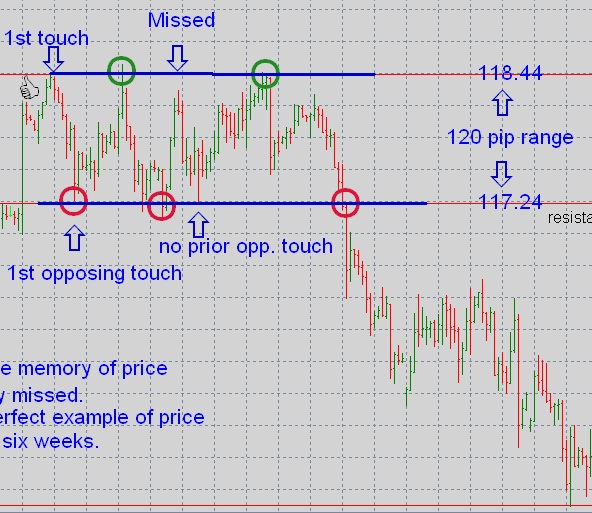
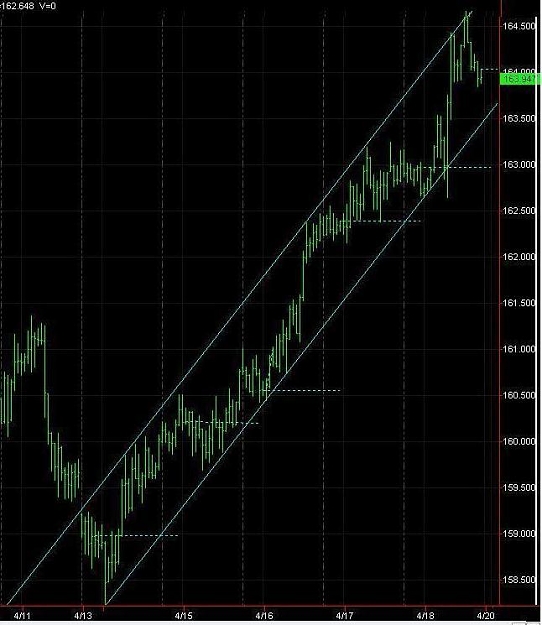
As Cindy XXXX says, the longer the consolidation, the bigger the breakout (rule of thumb). I learned to measure it this way and it works well, more often than not. First we define the channel. Where price enters the beginning of the channel, that ...
Tools to determine price range after a breakout?
- billflet replied Sep 17, 2010
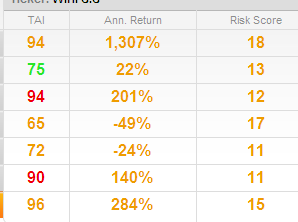
Are these returns for real? They're taken from Winsor's account on your site, but Winsor claims his results are far less spectacular.
Vote: Adding Rule for Commercial Members
- billflet replied Sep 16, 2010
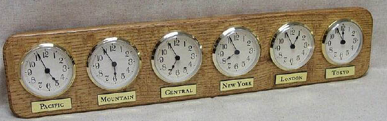
Like this, but mine is mahogany. One of these babies along with multiple monitors makes it look like we're doing important, complicated work.
Purchases you have made to help you trade:
- billflet replied Aug 27, 2010
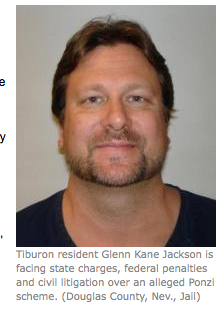
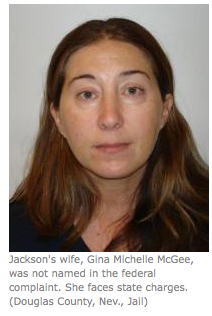
Another article. url With pics:
Jacko's Forex House of Pleasure and Pain
- billflet replied Feb 15, 2010
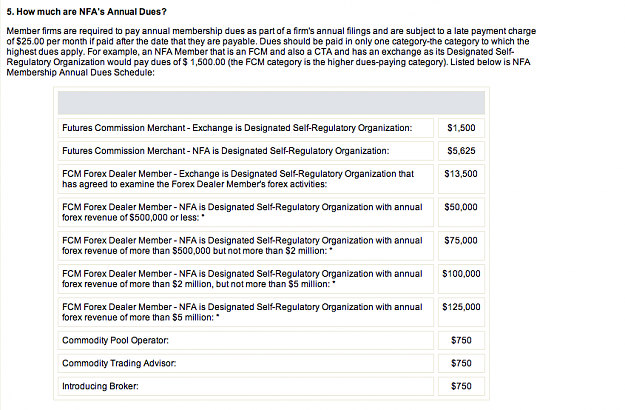
Sim, If you're starting a thread about NFA fees, why not visit their site? Googling "NFA" brings you straight to their homepage. Another couple clicks gets you here:
Guess how much NFA regulation costs
- billflet replied Sep 27, 2009
Good pick, Phil. Total range for past 30 days: About a tenth of a U.S cent.
Looking to trade very slow pairs, any suggestions....
- billflet replied Jan 6, 2009
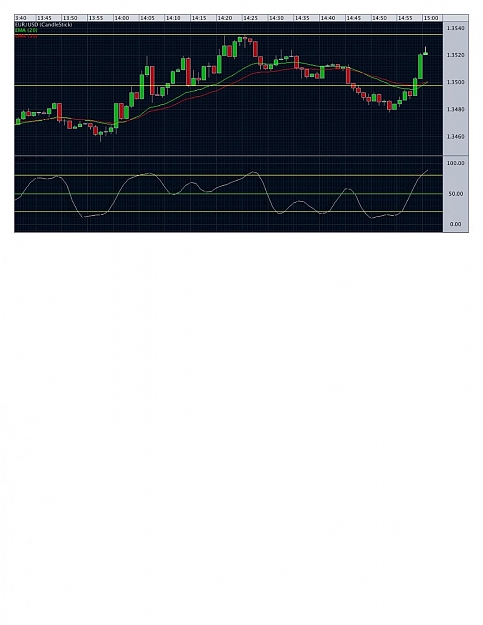
Like this: Click on chart preference Select print chart and your print window opens. Select print preview When the preview comes up, Select Save as. Now you can save it as a picture or a PDF. This is the first I've tried it. Glad I know how. It was ...
Attaching Oanda's Charts in FF.
- billflet replied Jul 15, 2008
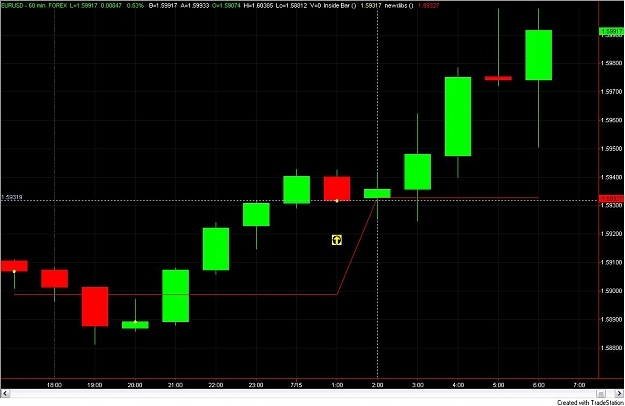
Also a Euro on Tradestation. The 0200am line is GMT 0600. The red IB with yellow arrow is at 0500GMT. I took it long at 1.5945 with 14 pips risk. Still in.
The DIBS Method... No Free Lunch continues

- billflet replied May 16, 2008
What a difference a few pips makes.
The DIBS Method... No Free Lunch continues
- billflet replied May 14, 2008
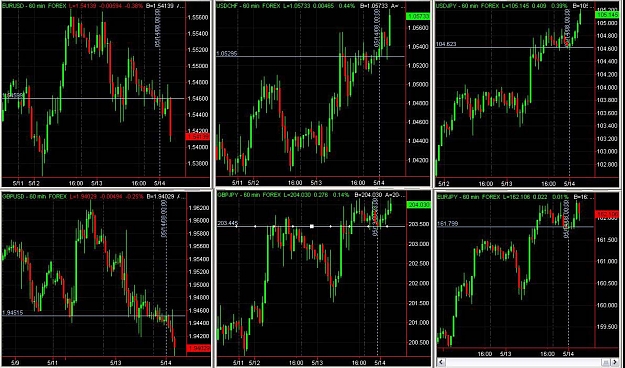
Anybody setting up a workspaces similar to this? I leave this running at all times because I've started applying the "Up Or Down On The Day" rule to all trades--DIBS or otherwise. Buying strength and selling weakness is making a measureable ...
No Free Lunch but all the Free Coffee you can drink
- billflet replied May 4, 2008
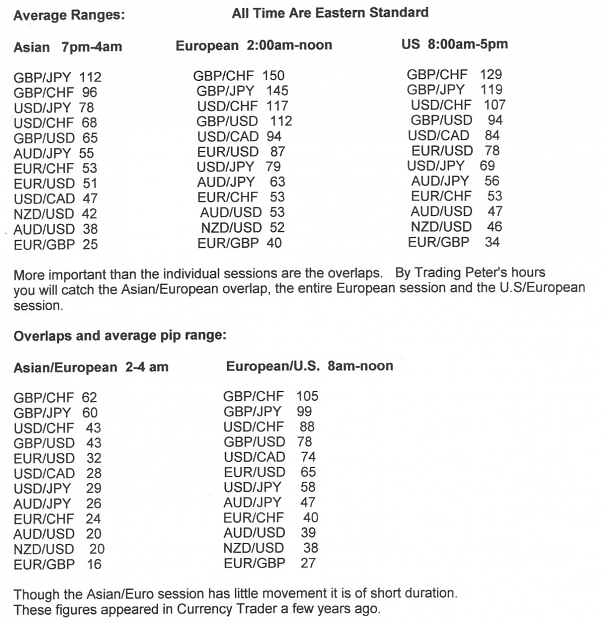
time of day — This is a list of the average range of several different pairs throughout the different sessions and more importantly the overlaps. By trading the hours Peter suggests, you will participate in the Asian/European overlap, the ...
No Free Lunch but all the Free Coffee you can drink
- billflet replied Apr 19, 2008
Yes, Bemac (Bill) I found this useful. When Peter mentioned the need for a stop method on the remaining piece of the trade, your method lept to mind. This week's hourly E/J was a good example of a stacking opportunity and your stop strategy would ...
No Free Lunch but all the Free Coffee you can drink
- billflet replied Nov 12, 2007
Here is a pretty good example all on one chart.
Exact Defination of Double Tops/Bottoms
- Posts by Member Search: 'billflet'