- Search Forex Factory
- Statistical analysis of trading (PA, MM and more...)Started Feb 13, 2015|Trading Discussion|3 replies

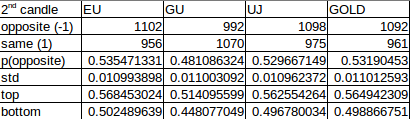
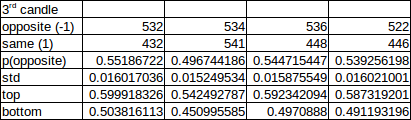
Hello, I study statistics and forex is my hobby. I would like to share my observations and analysis ...
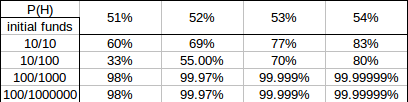
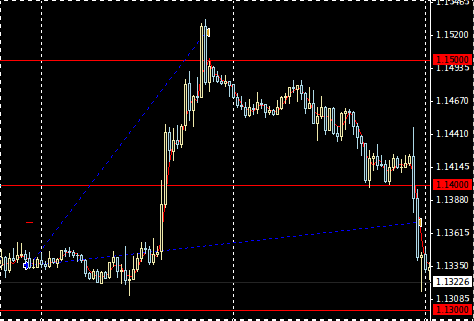
Hello, I study statistics and forex is my hobby. I would like to share my observations and analysis ...