- Search Forex Factory
- 27 Results
-
 Shug replied Dec 9, 2014
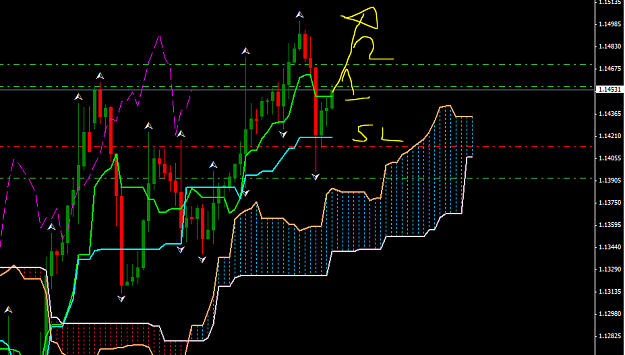
Just opened a buy at current market. Additional buy coming in about 20 pips higher. I think this is headed higher, but keeping SL tight (bout 30-40 pips) in case not. image
USD/CAD
- Shug replied Dec 9, 2014
Same. Wish i was at my comp for this. Lotta pips left on the table.
USD/JPY Discussion Feel ya bro lol... image

- Shug replied Dec 9, 2014
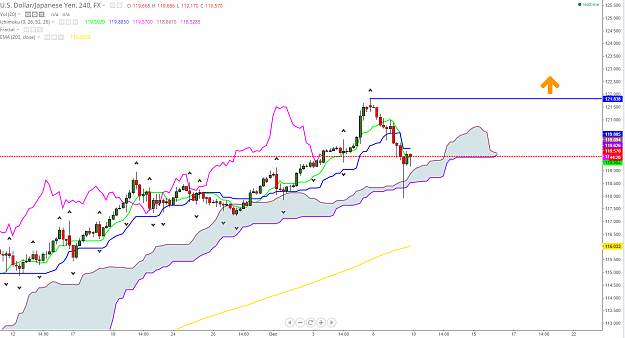
I like an additional buy on the break of this high. image
USD/JPY Discussion
- Shug replied Dec 9, 2014
Possible move up if these little resistance levels are broken. If the 4hr 200 ema breaks and holds, it may go quite a bit higher. Still bearish biased though. image
Cable Update (GBPUSD)
- Shug replied Dec 3, 2014
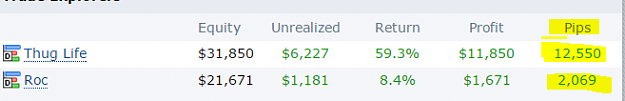
Not sure where you got 20 days? image To answer your question, no, i put this on hold a while ago, which is why i haven't been active in this thread.
Need Beta Testers For New Expert Advisor
- Shug replied Dec 3, 2014
Pipster, I'm sure you're pulling your hair out right now trying to deal with all these people, so i wanted to make things easy for you. Loaded your EA to a Finfx demo account and have it running on my vps 24/7. Please see the TE called 'Pipster' I ...
Try My EA! Need Group Feedback...

- Shug replied Nov 9, 2014
image Trend is your enemy? Well might as well stop working on my trend trading EA's. Now i gots to start over :'( Hey Ullen, would you be so kind as to teach your counter trend trading stuffs pwease?!?!
Counter-trend trading
- Shug replied Nov 2, 2014
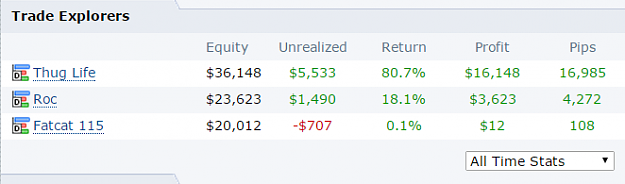
image These accounts are about 20 days old. The EA has been running 24/7 on a VPS.
Need Beta Testers For New Expert Advisor
- Shug replied Sep 1, 2014
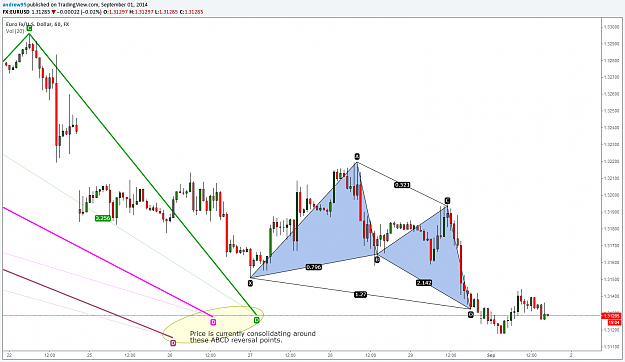
Price is consolidating around some pretty big ABCD pattern's D points. Thinking there will be a push up to minimum of .250 (fingers crossed, as i'd like to get the fuq out of my longs lol) Wouldn't be surprised if we see .105 before a pullback. ...
EURUSD
- Shug replied Sep 1, 2014
this should be a little more clear
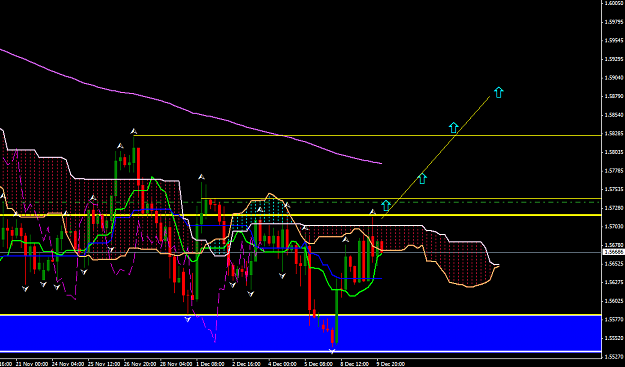
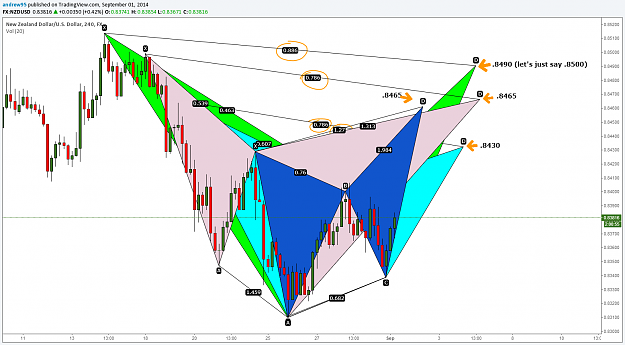
NZD/USD Thinking it will head down to .8200 area after it hits one or more of these reversal levels. Of at least get to .822 eventually. image
- Shug replied Sep 1, 2014
If price rallies, here are possible resistance/reversal levels. image .8430 .8465 .8490 (.8500)
NZD/USD
- Shug replied Sep 1, 2014
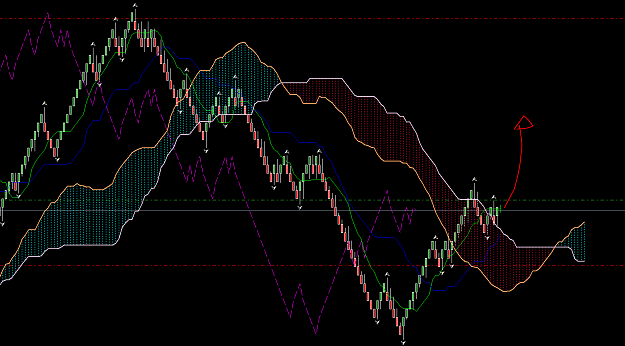
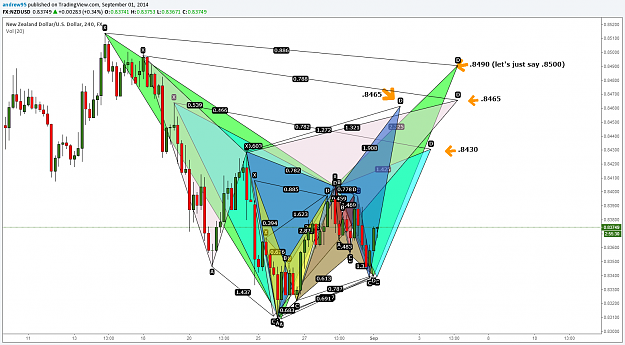
This area will be hard to break, but i think if this channel is broken, and the harmonic resistance area is broken, we could see a move higher. image
NZD/USD

- Shug replied Aug 27, 2014
EU broke out of its range. I'm thinking it will range for a few hours til London open then make another leg up. image
EURUSD
- Shug replied Aug 24, 2014
E/U is at a strong level of harmonic confluent support. It's also pretty oversold, especially on the 4hr chart. Not going long, as i'm already down quite a bit lol... (daily chart) image
EURUSD
- Shug replied Aug 23, 2014
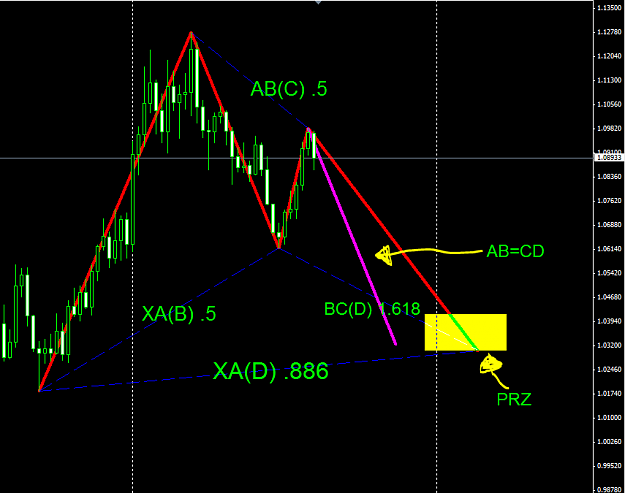
My apologies, as this post doesn't have anything to do with solar power, or bio fuels... My view of E/U as of now. image Price is in PRZ, which contains some nice confluences (weekly chart) If this area holds, I see price running up to 1.45-1.5 ...
EURUSD
- Shug replied Aug 17, 2014
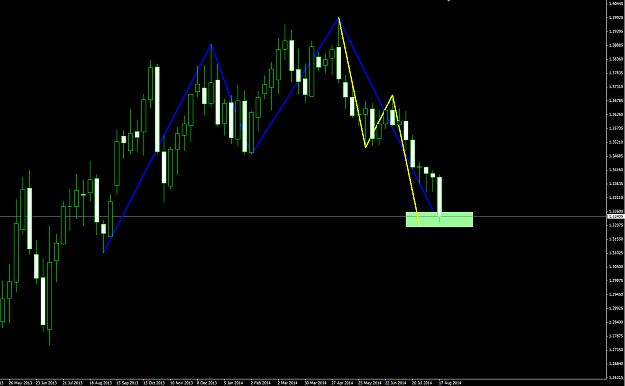
If the 5-0 pattern plays out it could confirm the 50% retrace for point C on this giant weekly bat (USD/CAD) image
Ratios & Harmonics: a Different Way to Trade
- Shug replied Aug 17, 2014
If the 5-0 pattern plays out it could confirm the 50% retrace for point C on this giant weekly bat (USD/CAD) image
Making Bank: The Harmonic rhythm of the market

- Shug replied Aug 17, 2014
Wanted to share some patterns in the harmonics threads on FF. image Patterns included: Bearish 5-0 Bullish Shark Bearish Reciprocal ABCD Bullish ABCD Bearish Butterfly Bullish Bat
Making Bank: The Harmonic rhythm of the market
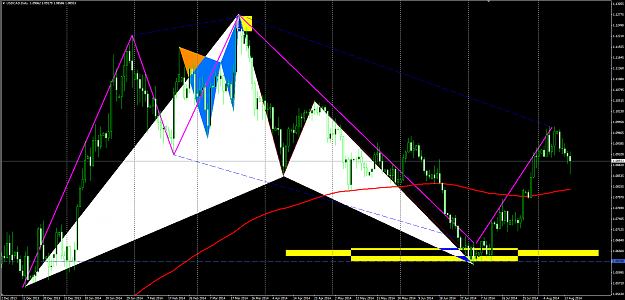
- Shug replied Aug 17, 2014
Wanted to share some patterns in the harmonics threads on FF. image Patterns included: Bearish 5-0 Bullish Shark Bearish Reciprocal ABCD Bullish ABCD Bearish Butterfly Bullish Bat
Ratios & Harmonics: a Different Way to Trade
