- Search Forex Factory
- 5 Results
- SantoTrader replied Aug 18, 2018
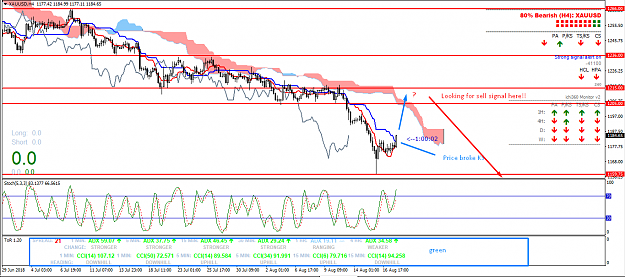
XAUUSD (Gold H4) The price broker KS (showing bears weaken) and it gives us clue that the price can retest the cloud. As you can see the cloud is in the resistance level area. There we can look for a sell signal. By analying like this we can make a ...
Ichimoku forever
- SantoTrader replied Aug 18, 2018
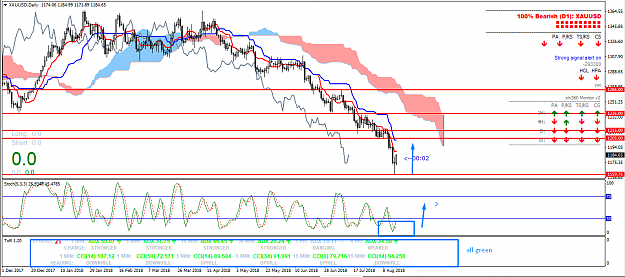
Gold Daily. What we get from the chart ? 1. Strong momentum bullish (Tor 1.2 all green) 2. Stoch is oversold (bullish preference) 3. There is candle shift from black to white (bullish preference) 4. TS & KS flat (pullback signal) 5. SSA & SSB flat ...
Ichimoku forever

- SantoTrader replied Aug 18, 2018
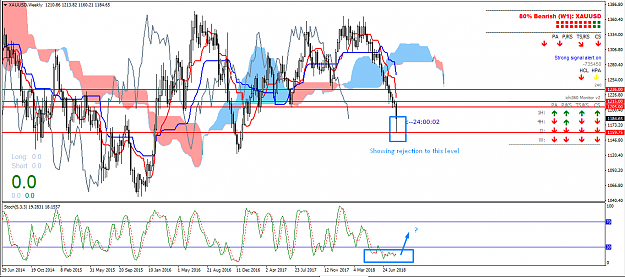
XAUUSD (weekly) What are in the chart? 1. CS below cloud (bearish bias) 2. Future kumo (strong bearish bias) 3. TS below KS (strong bearish bias) 4. Price show rejection level support (bullish preference) 5. Stochastic is oversold (bullish ...
Ichimoku forever
- SantoTrader replied Aug 18, 2018
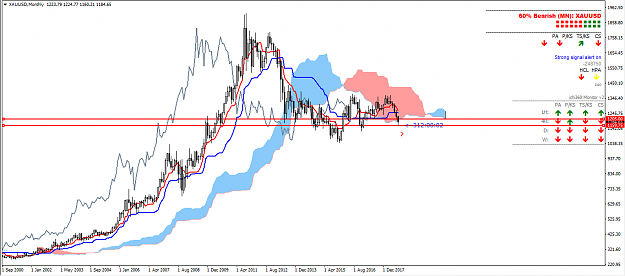
XAUUSD (monthly) What are in the chart ? 1. The trend is sideway 2. Future kumo (bullish bias) 3. TS above KS (bullish bias) 4. The price in the area of strong support (bullish preference). 5. CS below the price, KS & TS (bearish bias) 6. The price ...
Ichimoku forever
- SantoTrader replied Apr 13, 2017
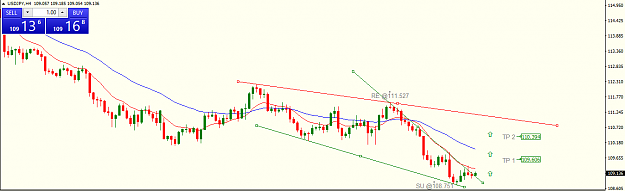
Hello, guys. I just saw this morning chart USDJPY in 4 hours time frame. I want to share the strategy for swing trader. It has support @108.750 and resistance @111.527. From my view, the price can go to 110.394. The price entry will be 109.190, stop ...
USD/JPY Discussion
- Posts by Member Search: 'SantoTrader'