- Search Forex Factory
- 9 Results
-
 PaulEamonn replied Mar 30, 2009
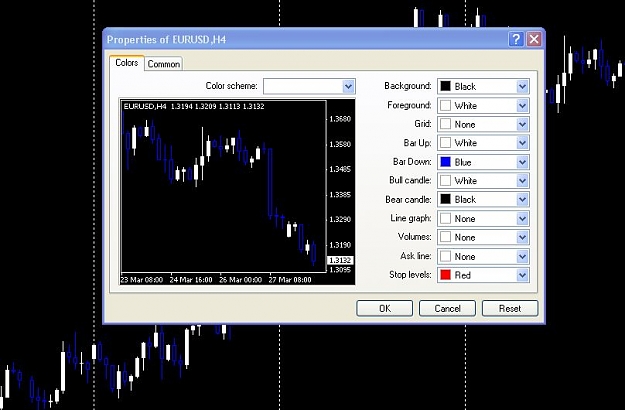
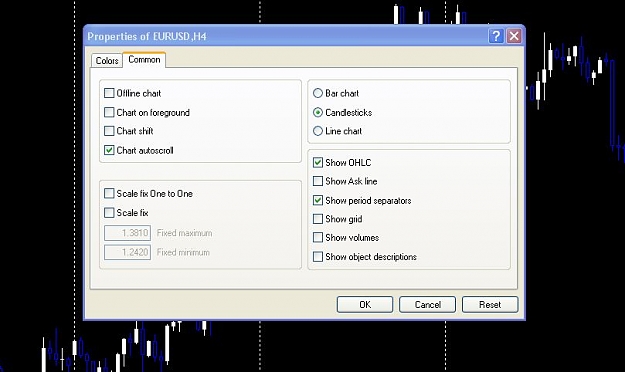
In Metatrader4 right click on the chart and select 'Properties' There are two tabs to the window that comes up. The setting should be the same as shown in the attached .gifs
No Brainer Trades
- PaulEamonn replied Mar 12, 2009
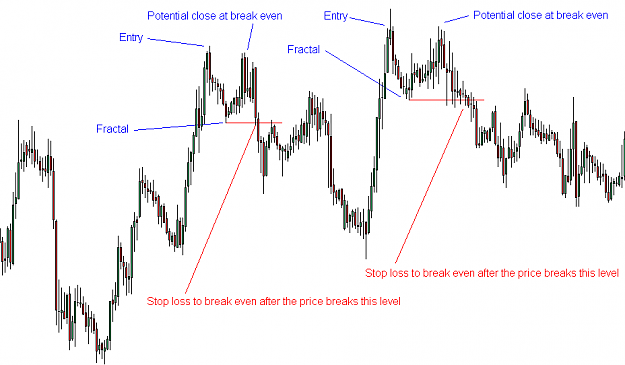
Morning RC - I read of, what I've come to call, a dynamic rule for moving your stop loss to break even. I can't remember where I read it or I would give the person due credit. I've taken a convenient bit out of the Euro/GBP to illustrate - it is an ...
No Brainer Trades
- PaulEamonn replied Mar 10, 2009
Euro USD — Does anyone think that the Euro is going to bounce down for a short scalp when it hits the 12753 level? Or is the consensus of opinion that the recent small retrace has reduced that likelihood? All criticism, derision or even ...
No Brainer Trades
- PaulEamonn replied Feb 17, 2009
Yes you are. Basically the most important point is the highest high or lowest low on the right of the chart. That is the point where all of the Fib studies should start. Where they finish is a matter of personal preference. Obviously they should go ...
No Brainer Trades
- PaulEamonn replied Feb 16, 2009
Hi Orcus Attached is the chart you asked for. I've put my interpretation of the price action onto the chart too. I'm not saying that it's right (and I hope we can get some comments on this because I'm learning too), it is just the way I saw it. You ...
No Brainer Trades
- PaulEamonn replied Feb 11, 2009
As you can see from the 4 hour chart there was one pivot high (the one I mentioned) at 13054. And there was another slightly higher one at 13065. Also the close of the bearish candle at the low you took your entry from is possibly more important ...
No Brainer Trades
- PaulEamonn replied Feb 2, 2009
Can we have wobbly buckets too? Seriously though, they do look good trades but I haven't yet got used to looking for them. OOOOPSS! I've not made as good a job as you at the artwork RC. Still, I'm sure you get the idea.
No Brainer Trades
- PaulEamonn replied Jan 29, 2009
See attached charts. Yes I can totally agree with that. Been there, done that!
No Brainer Trades
- PaulEamonn replied Jan 29, 2009
I've attached a couple of charts to show my calculations. It is easier than trying to explain it.
No Brainer Trades
- Posts by Member Search: 'PaulEamonn'