- Search Forex Factory
- 23 Results
- Onlinepips replied Sep 27, 2018
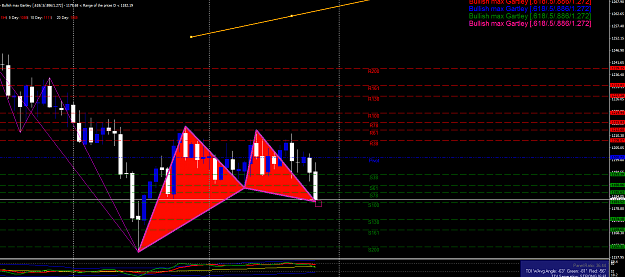
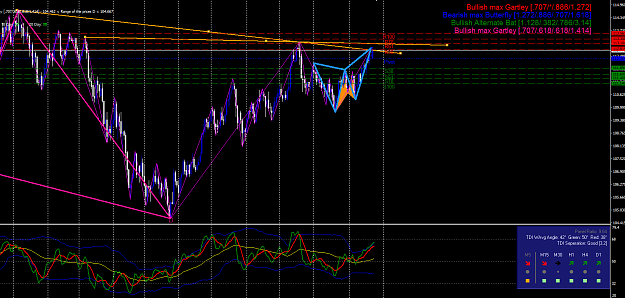
Is anyone thinking of XAUUSD gold? We have weekly pivot S100, its inline with previous small swing low daily, we also have a bullish max gartley on the daily price chart. 4hr chart has bullish max gartley and a bullish butterfly that complete at the ...
Weekly Pivot trading with TDI
- Onlinepips replied Sep 24, 2018
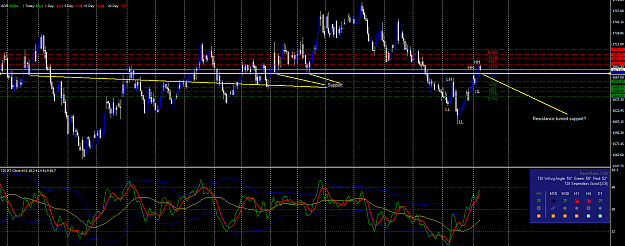
Are you already short on UJ, or are you waiting to see if it reaches R61 with those previous tails before entering?
Weekly Pivot trading with TDI
- Onlinepips replied Sep 11, 2018
Yeah there can definitely be different viewpoints between how to draw things!
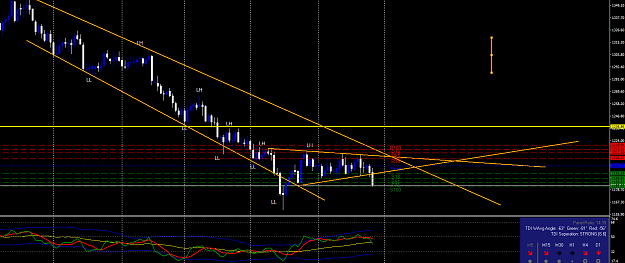
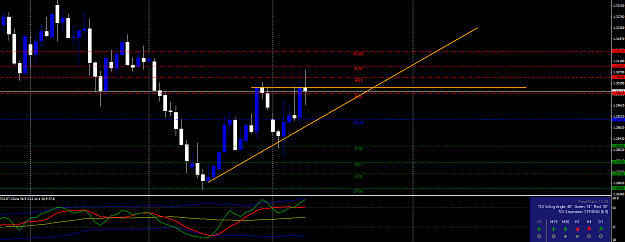
Weekly Pivot trading with TDI I've redrawn it this time without the yellow line and aligned both the top and bottom with the body to body.
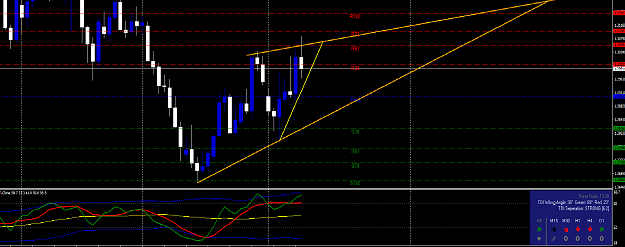
- Onlinepips replied Sep 11, 2018
Hi mate, Looked at it on the daily, and attached an image. I have the lower part of the wedge in an orange line, and also a yellow line. From what I've read I'm guessing the correct way is the yellow line?
Weekly Pivot trading with TDI
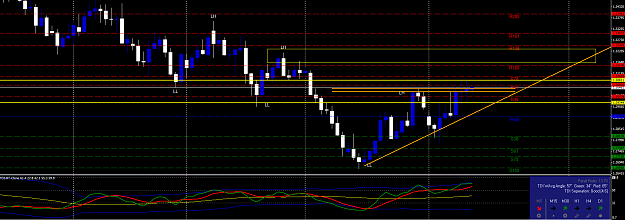
- Onlinepips replied Sep 10, 2018
I watched Neils video and found a chart not on there to draw some price action feel free to correct if wrong. Daily XAUAUD Changed from LL to HH as the expectation if drawn correctly. Yellow horzontal line is around the weekly pivot area. Perhaps an ...
Weekly Pivot trading with TDI
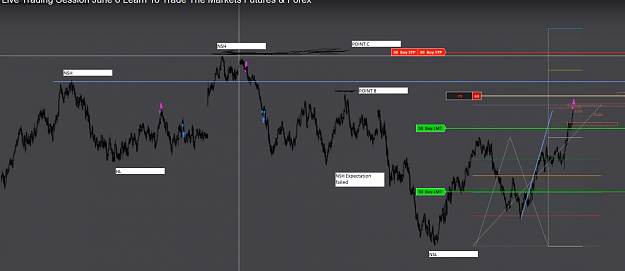
- Onlinepips replied Jun 15, 2018
Chart image from June video
Ratios & Harmonics: a Different Way to Trade
- Onlinepips replied Jun 11, 2018
Hey everyone, I watched Mr Pip Euro futures I think it was live stream replay. I didn't know you could draw 1to1s like he did near the start there to see if the market is in harmonic balance. So if you have a bunch of 1to1s, but then you just don't ...
Ratios & Harmonics: a Different Way to Trade
- Onlinepips replied May 17, 2018
After some reviewing, I believe price needs to close beyond point A for it to fail. I looked at a chart I posted ages ago and was told where the second failure point was. So when expectation fails, eg from NSL to NSH, you then take the LH that it ...
Ratios & Harmonics: a Different Way to Trade
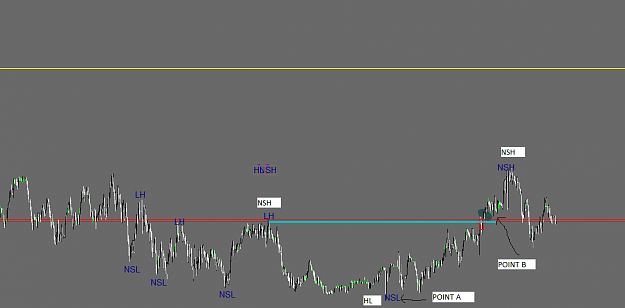
- Onlinepips replied May 17, 2018
Hey guys, NZDUSD M1 Same question as before, this time I marked out point A and point B. Price made an expectation failure. That's easy. What I'm still unsure of is where the next failure point is. I sometimes get double failures in a row and unsure ...
Ratios & Harmonics: a Different Way to Trade
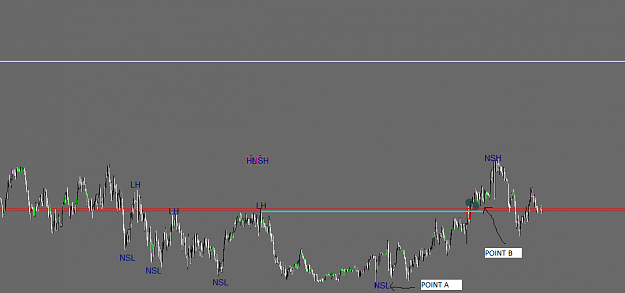
- Onlinepips replied May 17, 2018
Hey guys, I'm still learning where the failure points are. Attached chart image of NZDUSD M1 time chart. Just had an expectation failure. If price goes above "where?" it becomes an double expectation failure. I haven't labelled point a or point b, ...
Ratios & Harmonics: a Different Way to Trade
- Onlinepips replied May 1, 2018
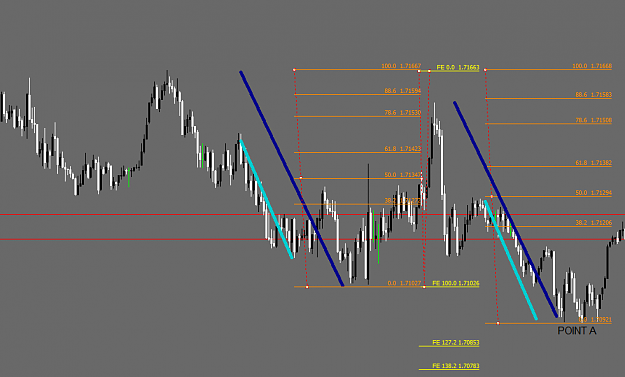
Thanks guys, The EURNZD did end up reaching 61.8fib of AD, it kept going all the way back up to the dark blue A. About confluence, I redrew the chart without the aqua light blue that had the failed AB=CD since price went above the A point. 1:1 of ...
Ratios & Harmonics: a Different Way to Trade
- Onlinepips replied Apr 29, 2018
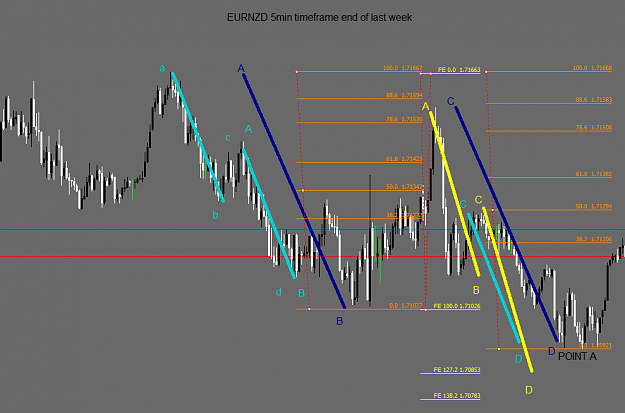
Thanks guys. The chart is EURNZD, 5minute time chart that is from the very last part of last week. By instrument you mean whether it's a tick chart or a time chart? I redrew the lines in different colours and put letters on the respective colours ...
Ratios & Harmonics: a Different Way to Trade
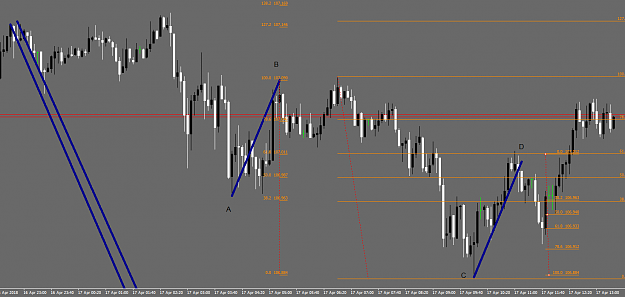
- Onlinepips replied Apr 29, 2018
Hello traders, I have attached a screenshot. So the light blue is AB=CD. The dark blue is ABCD pattern. There was double confluence where they both added up, and price seems to have gotten to the 38.2 already. But, the dark blue, eg the ABCD ...
Ratios & Harmonics: a Different Way to Trade
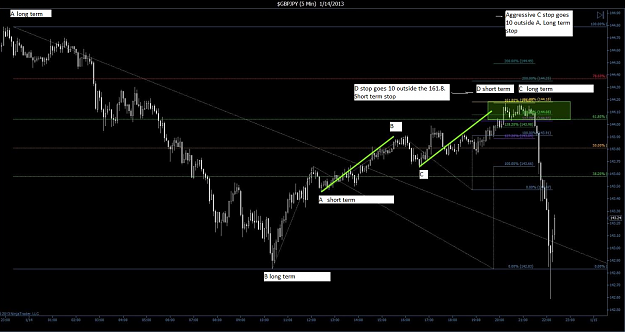
- Onlinepips replied Apr 17, 2018
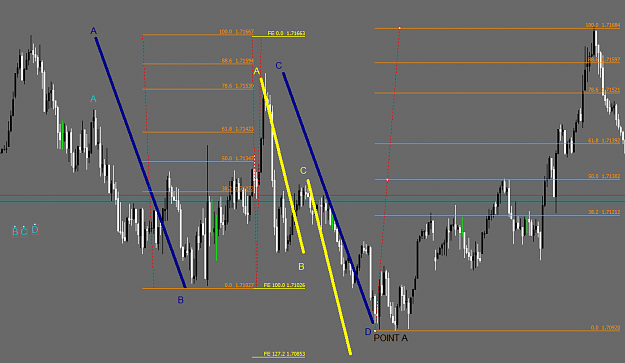
Hi, I have attached in image from Mr. Pip from a previous post, and I've drawn on it what I think is ABCD pattern that has formed at the C point of a longer term ABCD pattern. My question is, when you have a ABCD within an ABCD pattern, so you're ...
Ratios & Harmonics: a Different Way to Trade
- Onlinepips replied Apr 17, 2018
Hi Parviz, I'm new to the patterns, I think I understand structure, order flow. But patterns I'm not familiar. The AB=CD seems one of the easiest to learn. I've attached a screenshot. Is the pattern I marked an AB=CD pattern, or was it just a ...
Ratios & Harmonics: a Different Way to Trade
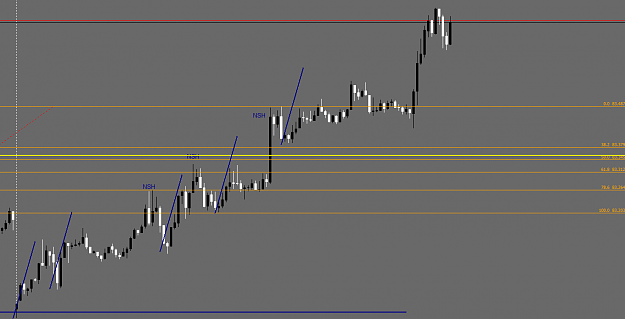
- Onlinepips replied Apr 11, 2018
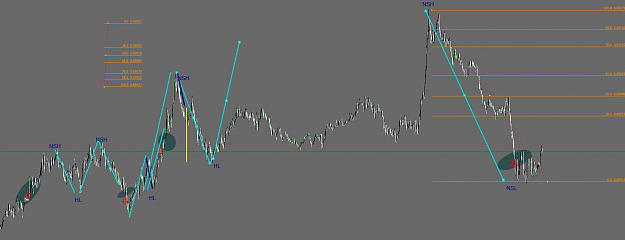
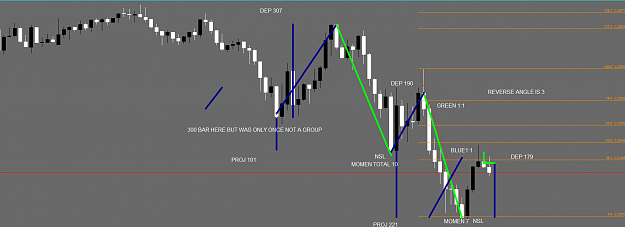
Quick question, Between the 2 NSH here, you can see there are 2 large tails during the correction. I know you only put NSH if it closes beyond the tail of the previous NSH. My question is, if there is a large tail in the correction, does the next ...
Ratios & Harmonics: a Different Way to Trade

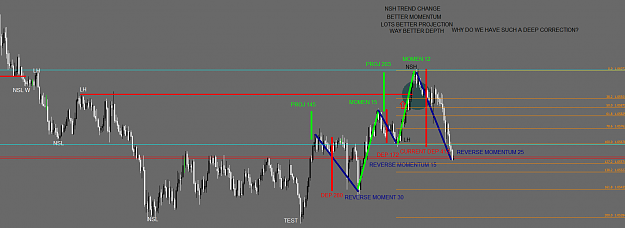
- Onlinepips replied Apr 6, 2018
I have attached a screenshot. Had 3 green lights for order flow. Eg better projection, better momentum, less depth. Yet if I had of entered this one at say 38.2 or 50.0 fibonacci as a NSH/BUY would have gone against. You can see I got nearly 1:1 on ...
Ratios & Harmonics: a Different Way to Trade
- Onlinepips replied Apr 5, 2018
Went sell/short on the EURUSD 15min time chart
Ratios & Harmonics: a Different Way to Trade
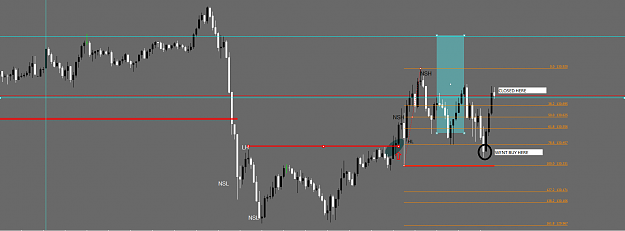
- Onlinepips replied Apr 3, 2018
Had wins and losses today thought I'd post a win one just finished now. Had already been in this trade a little earlier and closed it from the earlier swing but it hadn't made a NSH yet so even better risk reward when it came back down to 786fib so ...
Ratios & Harmonics: a Different Way to Trade