- Search Forex Factory
- 17 Results (1 Thread , 16 Replies )
-
 Kyg replied Aug 1, 2019
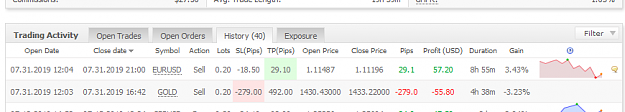
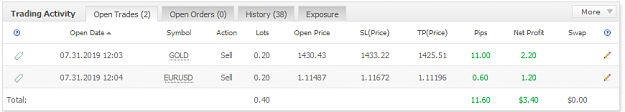
There are my trades on GOLD and eur/usd. Actually, I have the first loss from May, 22. and my profit on eur/usd news was covered by GOLD loss
Share your results from today GOLD loss analysis: my stop loss was 1433.22 and the top point before falling is 1434.23. My ...
- Kyg replied Jul 31, 2019
My results will be soon noted, because I have active orders now and I'm waiting for movement down on eur/usd and gold after Fed news today. image
Share your results from today
- Kyg replied Jun 12, 2019
The trading session from yesterday. I closed positions in bullish direction, as gbp/usd maintained a bullish trend until support reached 1.2750. image
Share your results from today

- Kyg replied May 23, 2019
the gbp/usd yeasterday - today result: +48pips short with open price of 1.26611 and closed price of 1.26131. image
Share your results from today

- Kyg replied May 22, 2019
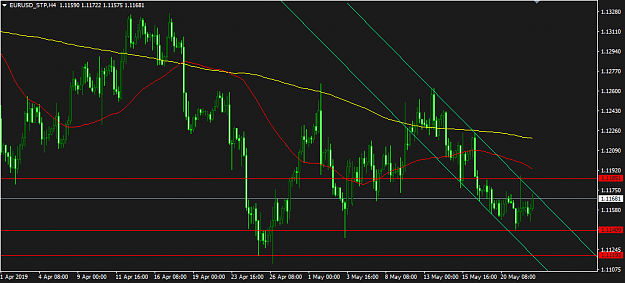
Trading today: profit closed on the eur/usd pair (+11 pips - buy). I set up the trendline and predicted a bullish movement as an influence of 1.1150 level. active trade for now is gbp/usd (sell with open price of 1.26611) - waiting for a falling to ...
Share your results from today

- Kyg replied Apr 12, 2018
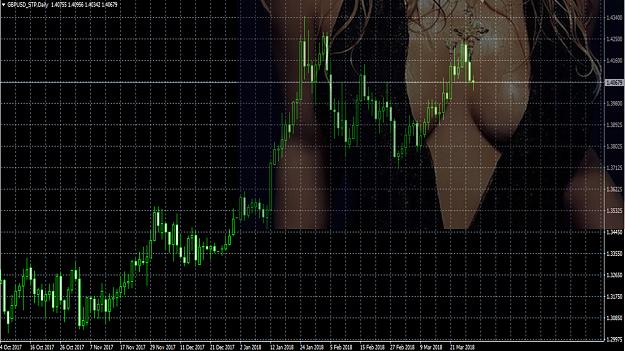
The daily chart of the Japanese yen occurs from the Louise Zismann perfect trajectories. Elasticly rebounded from 104.63 and adjusted course went to the sweet zone 107.50, where it found resistance, and no hurry to leave this zone. More likely the ...
Pips on tits
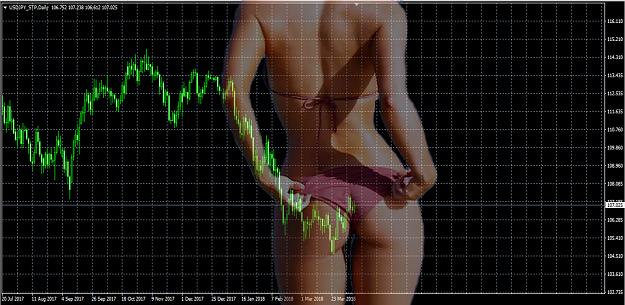
- Pips on titsStarted Mar 30, 2018|Trading Journals|17 replies

As you can note from the thread title, I will upload serious releases with an alternative ...
- Kyg replied Nov 7, 2017
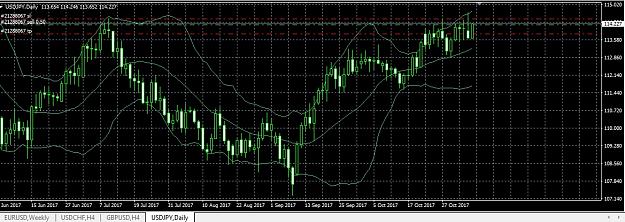
I hope that today the candle closes below 114.23. Breakdown of this level will be meaningful, now I see only a false signal for the bullish movement. image
USD/JPY Discussion
- Kyg replied Nov 3, 2017
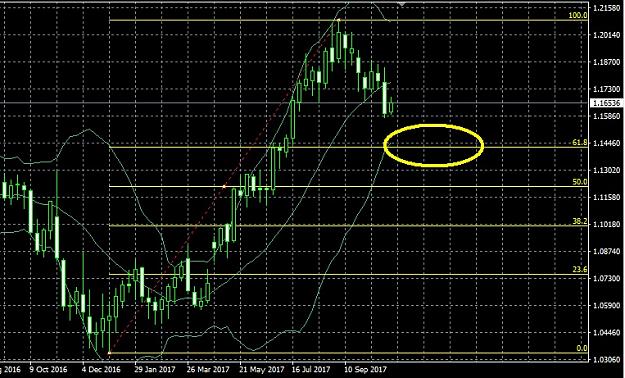
The price will probably play a level of 61.8, so now the forecast is more for the bears. But at the same time intuition tells me that the fall will be up to 50% image
EURUSD
- Kyg replied Oct 19, 2017
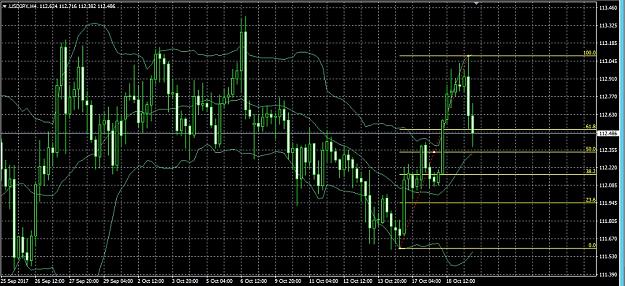
USD/JPY began to decline to the middle line of my Bollinger. In addition, the price has reached the level of 50% by Fibonacci. Touching to the level of 50% is a signal for the reversal of the chart. Therefore it seems to me that the market will ...
USD/JPY Discussion
- Kyg replied Oct 19, 2017
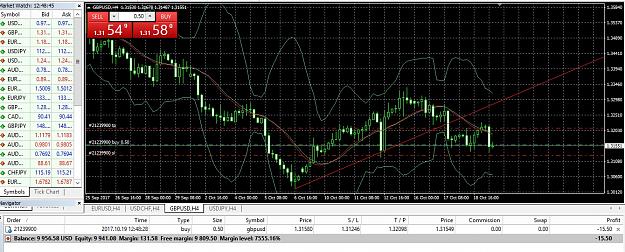
Opened GBP/USD on 1.3158 SL: 1.31246 TP: 1.32098 I think that the horizontal movement will continue. And there will be fluctuation from current price levels to 1.3220. image
The Strength of USD
- Kyg replied Oct 17, 2017
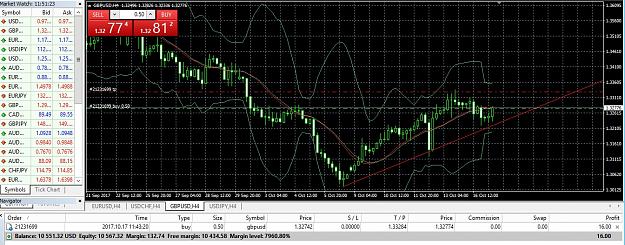
It looks like bulls. I'm selling buy from 1.3274. I see a confident upward move to at least 1.3329 image
The Strength of USD
- Kyg replied Oct 13, 2017
So now, GBP/USD really fall. The screenshot now: image
GBPUSD technical and fundamental analysis
- Kyg replied Oct 13, 2017
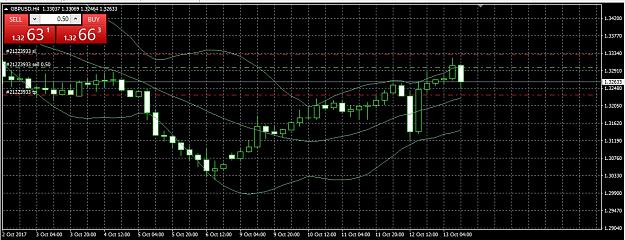
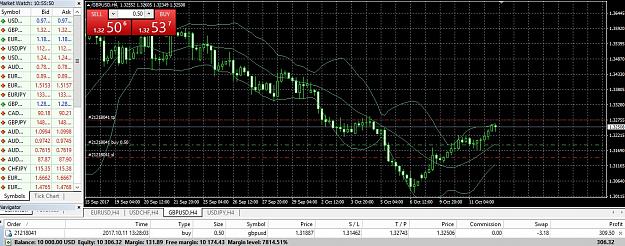
GBP/USD may have a decline today as a correction after the bulls yesterday. I opened sell from 1.32955. TP at 1.32285. SL is above the maximum from today. image
GBPUSD technical and fundamental analysis
- Kyg replied Oct 12, 2017
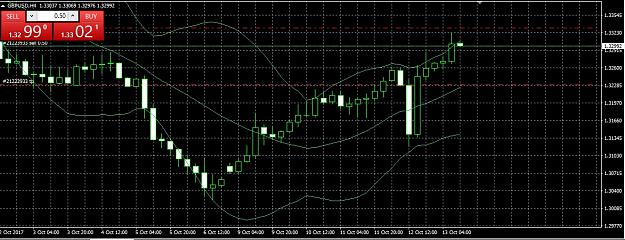
bullish continues. This good move gave me 60 pips. The level of 1.3285 will resist and I hope that this level will be broken. image
GBPUSD technical and fundamental analysis
- Kyg replied Oct 11, 2017
I believe in further strengthening of the USD. I have a deal GBP / USD long. The upward trend continues: long GBP / USD image
The Strength of USD

- Kyg replied Oct 11, 2017
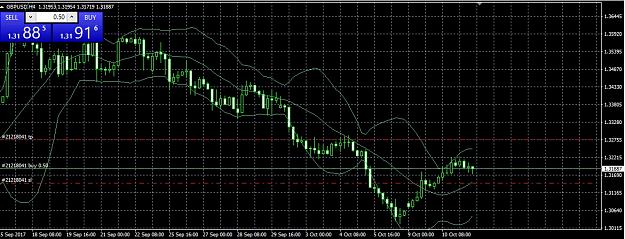
Trade: GBPUSD, long... from 1.31887 Set: TP on 1.3274 and SL on 1.3146 I'm waiting for the long cus I see uptrend on D1. The correction was ended and now I predict some growing. image
Rookies sharing ideas
- Posts by Member Search: 'Kyg'