- Search Forex Factory
- 33 Results
-
 John-Pacman replied Apr 20, 2018
is it a triangular formation ? i don't know but if it so then logical next target is 1.255567 image
EURUSD only

- John-Pacman replied Feb 20, 2018
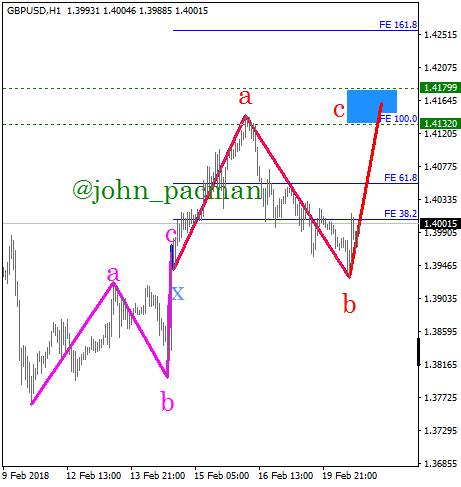
my micro count level is this i see double flat with first as b-failure(magenta)-x-irregular flat(red). from this i can project the next level to 1.41799 - 1.41320 image
Elliot Wave Analysis
- John-Pacman replied Feb 19, 2018
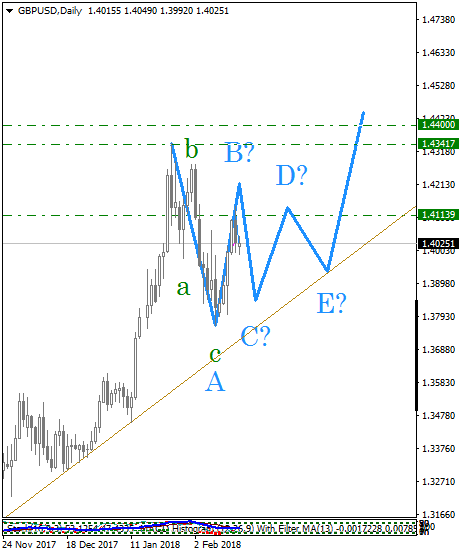
i see first retracement on GBPUSD as an elongated flat (which c-green is more than 161% of b), it gives early warning sign of triangular formation image
Elliot Wave Analysis


- John-Pacman replied Jun 29, 2017
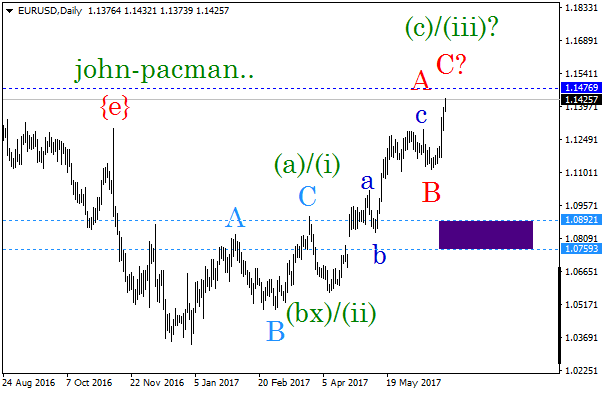
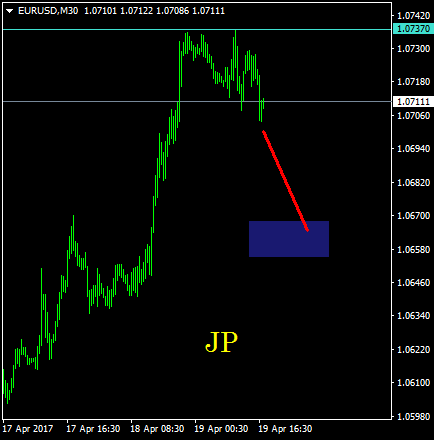
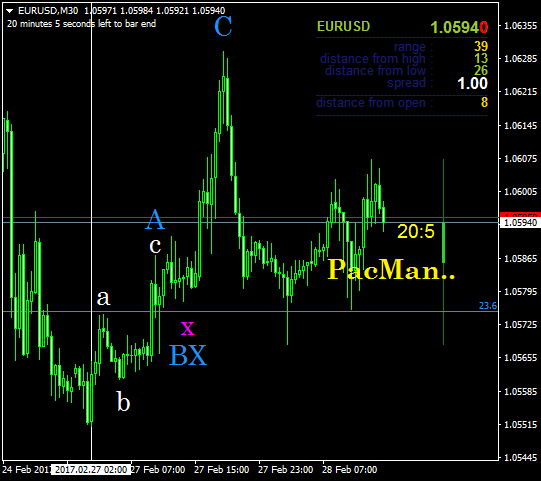
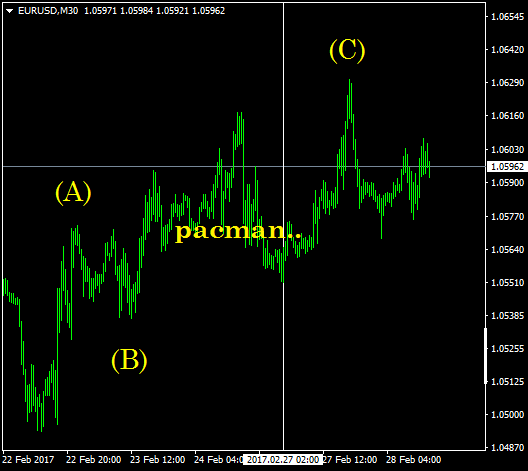
As an alternative count on EURUSD if it is a complex corection (a)(bx)(c), then it has to retrace to purple box but if it is an impulse, PA has to touch or exceed level 1.147685 and never can be retraced to 1.075927 image
Elliott Wave Trading
- John-Pacman replied Jun 6, 2017
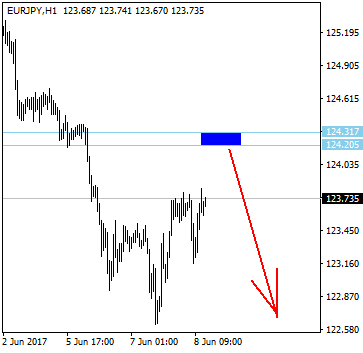
agree with you Mzwandile93, still has to test that high which will make false break. image
Elliott Wave Trading

- John-Pacman replied Mar 25, 2017
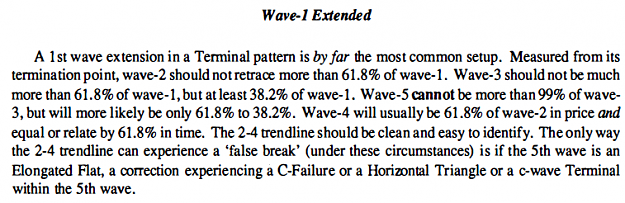
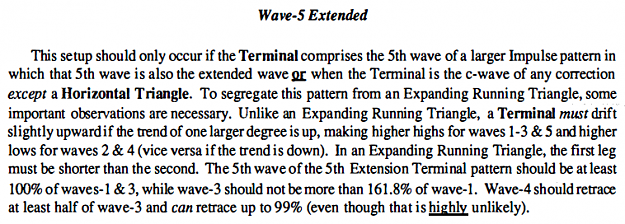
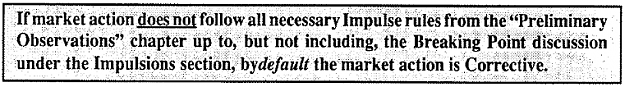
back to topic, since your label does not shows any extended wave then it is a corrective not an impulse. even on an E-diagonal, or some call it terminal, extended wave must be present. and it is rule. image image
Elliott Wave Trading
- John-Pacman replied Mar 25, 2017
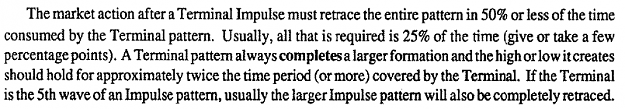
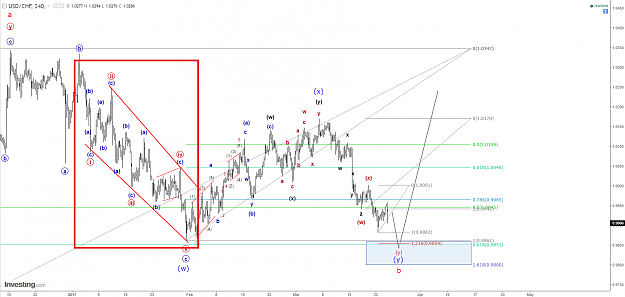
...but your label on usdchf is not E-diagonal since 4 does not violate 2nd zone, right? and Price Action [PA] after it end must retrace entire pattern in 50% or less the time taken by ED/terminal. but it don't image
Elliott Wave Trading
- John-Pacman replied Mar 25, 2017
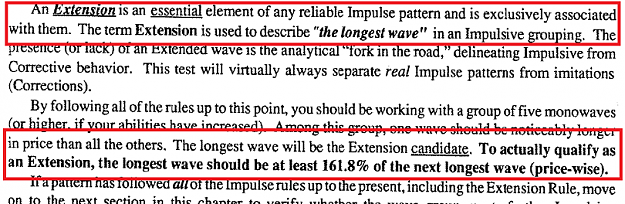
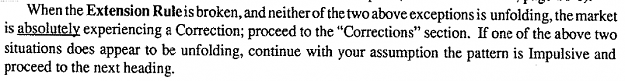
hi aalperbk, i'm sorry for this interruption, image could you please explain to me how come that (red box) formation be an impulse when there is no extended wave EW rule says; image image and rule of corrective is image
Elliott Wave Trading
- John-Pacman replied Mar 3, 2017
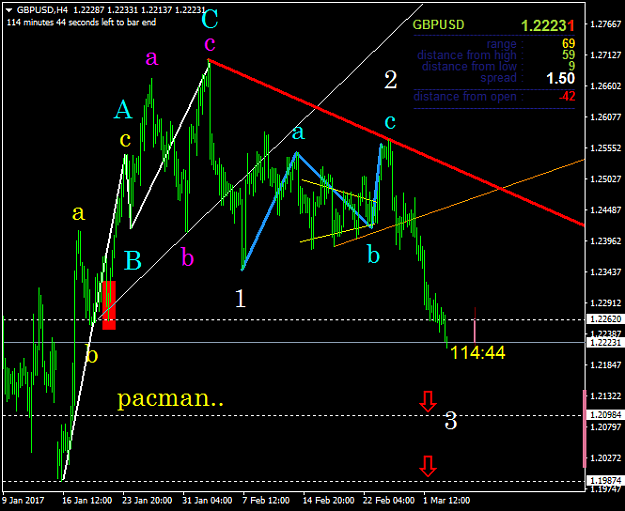
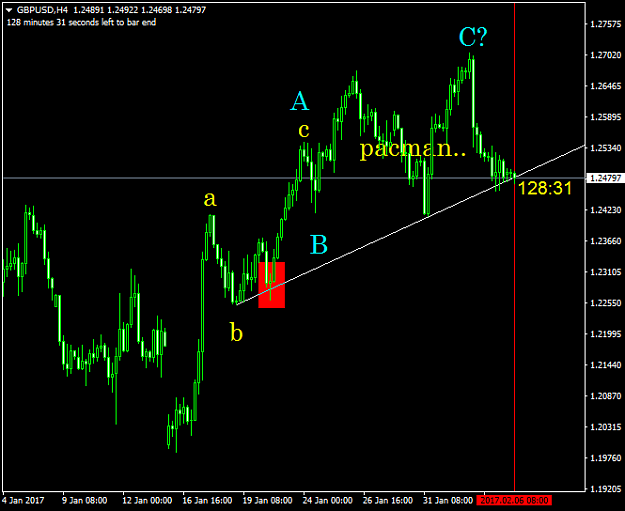
my count (for an alternate) on GBPUSD , since wave-3 is never the shortest (161% of 1 in this case) , new low will be touched in a short period of time. respectively target are (min) 1.20984 and (max) 1.19874 (110-220 pts) image
Elliott Wave Trading
- John-Pacman replied Feb 28, 2017
hi diavolul, there is no wrong with the label , all people here just wants to be simple (or to hide) image then for simplicity reason we just want to write it like this image
Elliott Wave Trading
- John-Pacman replied Feb 22, 2017
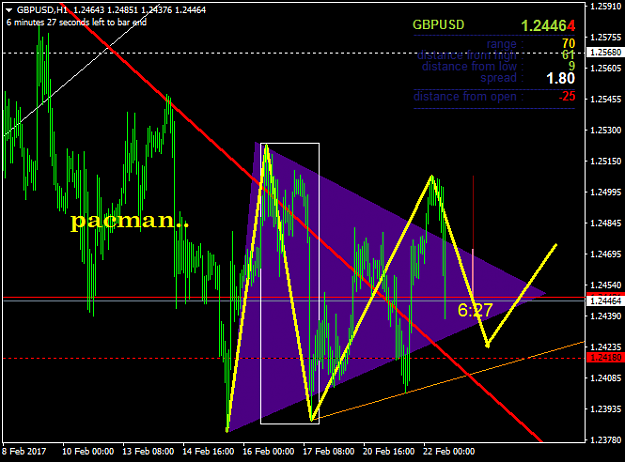
Is it a sign of a triangle (white box) ? Let's see image
Elliott Wave Trading
- John-Pacman replied Feb 15, 2017
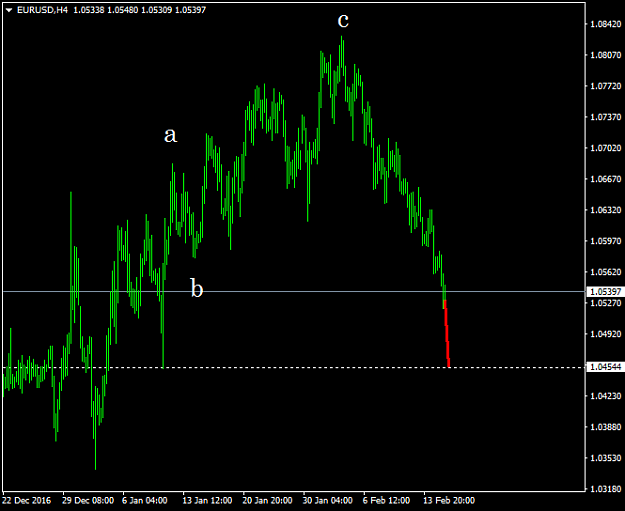
Is it going to test this level 1.4544 (90pts down) ? I do not know , lets see. image
Elliott Wave Trading
- John-Pacman replied Feb 6, 2017
Hi Jevan , welcome to the club you should re-label the formation to be 3 not 5. image this are some reasons why ; any PA of wave-(iii) DO NOT allowed to touch / break (ii)-(iv)trendline. according to the picture, (ii) retraces only 38% of (i), so ...
Elliott Wave Trading
- John-Pacman replied Feb 4, 2017
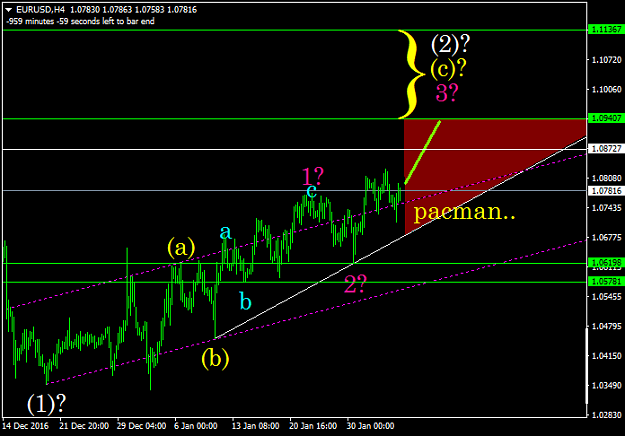
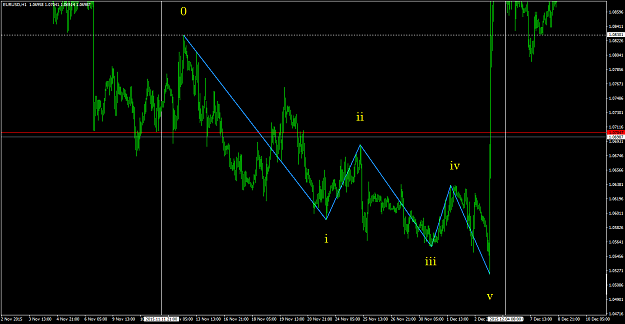
my analysis on EURUSD image if we see wave 2? retraces more 38% of 1? then we can expect 3? between 1.09407 - 1.11367 ('cos 3 never be the shortest - it's rule). This condition is still valid as long PA never break or touch the white trendline ...
Elliott Wave Trading
- John-Pacman replied Jan 22, 2017
this is the best example of an "Ending Diagonal" on EURUSD see the post construction-formation, ED was fully retraced by PA , this move is mandatory and serves as a confirmation that the formation is valid. without it , the formation is invalid. ...
Elliott Wave Trading
- John-Pacman replied Jan 16, 2017
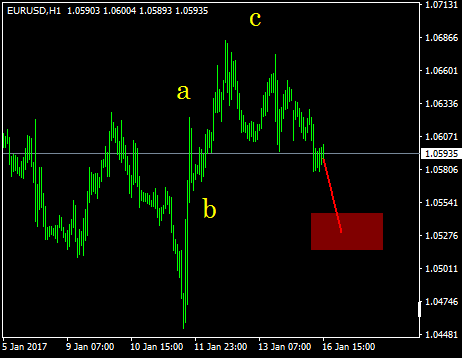
Will it goes down to the area ? potential profit 40-70pts 1:2 - 1:3. I do not know , lets see ... image
Elliott Wave Trading