- Search Forex Factory
- 35 Results
-
 Dabestone replied Mar 16, 2015
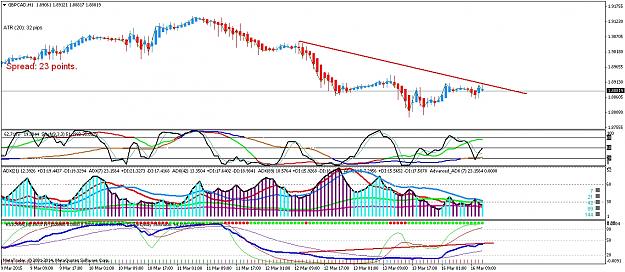
Waiting for this setup for entry: GBPCAD 1H chart. Divergence on 1H. image
Alien's Extraterrestrial Visual Systems
- Dabestone replied Mar 16, 2015
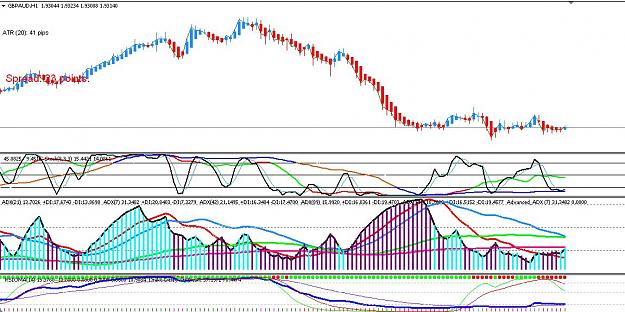
Any opinion guys? GBPAUD 1H chart. BBS with DS setup. Will be waiting for ADX to gain strength for entry. D1 has BBS with ADX compressed below 30. 100 Sto and RSIOMA turning downwards. 4H direction is downtrend. image
Alien's Extraterrestrial Visual Systems
- Dabestone replied Jun 25, 2010
Here's what I've got for GBP/USD .. This is a 1Hr trade... Lower high created... QQE and CCI both sloping down and heading negative value. Price has closed below 89 Ema...SL set at previous swing high. TP1 set at 1.4800 ... lets see how it goes.. ...
Sonic R. System
- Dabestone replied Jun 24, 2010
GBPJY short trade — Lower highs created... price SEEMS to resist 134.00 ... shorted at 133.92... will see if 134.00 holds... SL set the recent swing high.. just above Pivot line... TP set around Support 2 level.....
Sonic R. System
- Dabestone replied Jun 24, 2010
EJ short trade — Love the way price close below the pivot line @ 110.64, entered short @ 110.45 .... QQE and CCI sloping down... Stop loss set few pips above 111.00.... will trail IF it reaches +50pips... lets see how it goes.. cheers
Sonic R. System Edit: ...
- Dabestone replied Jun 23, 2010
EJ and EU Trade — My EU and EJ short since London open... Both TP set at Support 3 .... Trail with 45 and 35 pips respectively... lets see how it goes...
Sonic R. System
- Dabestone replied Jun 22, 2010
eurusd 15m setup — Pending short order just got triggered at 1.2265 while typing this... Price creating Lower Highs and Lower Lows.. just follow the trend... Lets see how it goes
Sonic R. System
- Dabestone replied Jun 22, 2010
EJ — Had entered short earlier on EJ... this is what I have for EJ... TRO sloping down.. LH created... and I like the circled area where it might be acting as a resistance now after being broken as a support. Stop Loss being set right above ...
Sonic R. System
- Dabestone replied Jun 21, 2010
Trade hits TP @ 1.2120 for +56 pips... Love the way price reacts to the Support 3
Sonic R. System
- Dabestone replied Nov 4, 2009
USDCHF — Monthly: Creating LH and LL. Downtrend Weekly: Downtrend. But am concerned with the current swing low. Can this current swing low and the swing low created on 2008.7.13 considered as DOUBLE BOTTOM? If so, it would be risky to consider ...
Strat's Long Term Stress Free Trading
- Dabestone replied Oct 25, 2009
EUR/GBP — Anyone looking into EUR/GBP? Monthly: More buying power than sellers' Weekly: Last week's candle close with a long lower wick. Rejecting 90.00 level. Daily: Price rejected 90.00 level which is also a fibo 38.2% drawn on daily swing ...
Strat's Long Term Stress Free Trading
- Dabestone replied Oct 22, 2009
EUR/USD — Strat mentioned that to look for how price reacts to the 1.500 area. Today's candle shows a hammer closing above it. Question: Is the hammer significant as shown in this position?
Strat's Long Term Stress Free Trading
- Dabestone replied Oct 22, 2009
NzdUsd — Here's what I see on NZDUSD Weekly: Bullish Trend. Buyers in control. Price has breach pass my SR line that I have at 0.7466 Daily: Hammer forming with 20 minutes before daily candle close. Looking to go long 10 pips above candle's ...
Strat's Long Term Stress Free Trading
- Dabestone replied Oct 18, 2009
OB on Boss — Hi Strat and Team, Attached is EURGBP. Weekly: Immediate trend is Bullish. But last weeks's candle close as a very bearish BEOB. It failed to close below 0.9100. Daily: Daily is in an uptrend. Price finding resistance at 0.9350 ...
Strat's Long Term Stress Free Trading
- Dabestone replied Oct 14, 2009
Below is my D1 chart for CHFJPY Daily has create LH and LL. Immediate trend on chfjpy is bearish with LH and LL as well. Price meet resistance at daily 50. IF today's bar can close below daily 20 and weekly 20, which also means a close below my SR @ ...
Strat's Long Term Stress Free Trading
- Dabestone replied Oct 14, 2009
CHFJPY SR lines — Hi Craig, if you may, could you post your chart for CHFJPY with SR lines with it? TF= Weekly. Am starting to pay more attention to SR lines for my trading. Don't trade into support and resistance, it's something precious that ...
Strat's Long Term Stress Free Trading
- Dabestone replied Oct 12, 2009
Question — Hi Strat and team, I've a question regarding trading into congestion area when nice price action presents. Below is a chart of USD/CAD for example. Note that it's only an example for my question, and I'm not trading it at the ...
Strat's Long Term Stress Free Trading
- Dabestone replied Oct 7, 2009
IB on EUR/USD — Inside bar on EUR/USD. Taking a breather before going north again? Question is, will this IB be considered as a good Price action in this level? IF, IF I am to enter the trade at the break of the top of the IB (1.4740), will it ...
Strat's Long Term Stress Free Trading