- Search Forex Factory
- 14 Results
-
 Dabbeljoe replied Sep 19, 2013
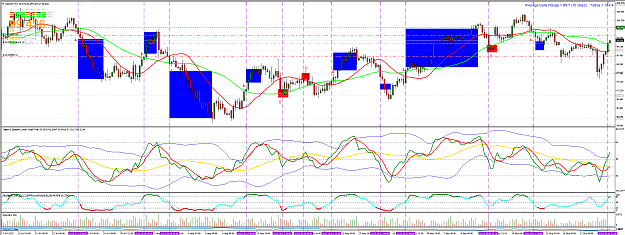
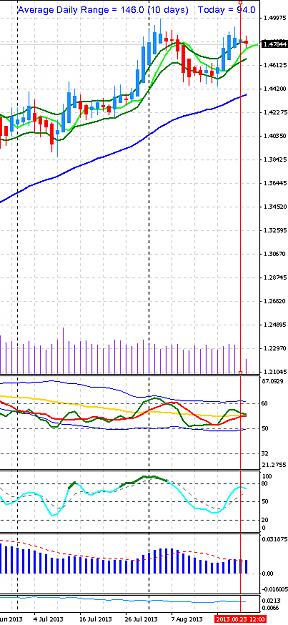
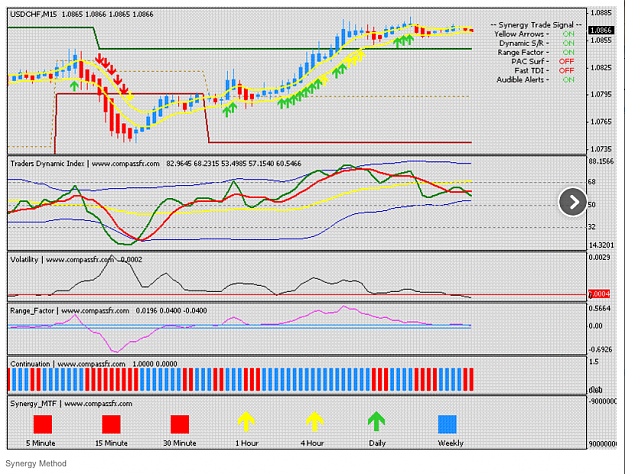
SMA 20 and SMA 40. Every time there is a crossing of green over the 50 line, meaning that sentiment is getting positive, the PA crosses the upper MA. And when the PA is going below 50, sentiment is getting negative, the PA crosses the lower MA. ...
Trading Made Simple
- Dabbeljoe replied Sep 19, 2013
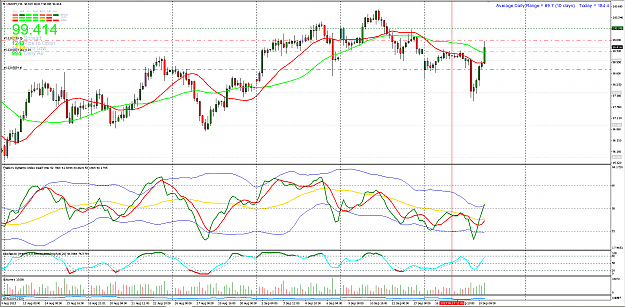
Yes, I did. I won't bother you with the major screwups I did this week because I was not sticking to my own strategy, I was impatient and greedy and not willing to close losers, I made all the beginner-mistakes the last few days, but now i'm back on ...
Trading Made Simple
- Dabbeljoe replied Sep 16, 2013
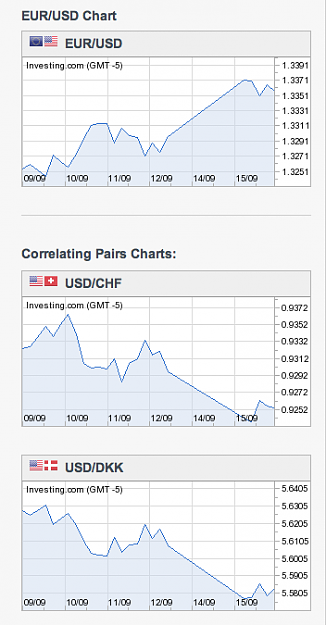
You mean correlation? What do you mean bij opposite? Negative correlation? I don't know what the CHF has got to do with this, DKK is the Danish Krone (crown). Although, there is indeed a high correlation between the USD/CHF and EUR/USD too. Since ...
Trading Made Simple
- Dabbeljoe replied Sep 3, 2013
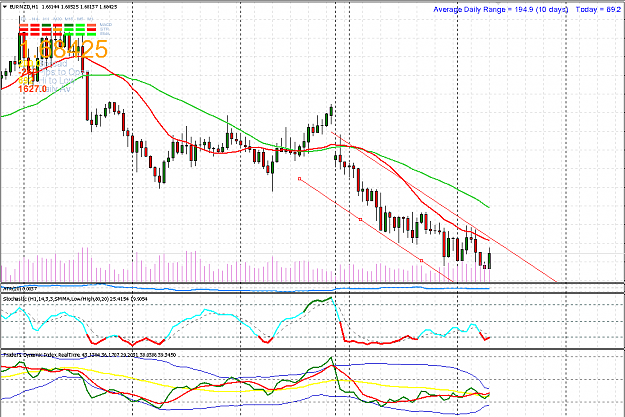
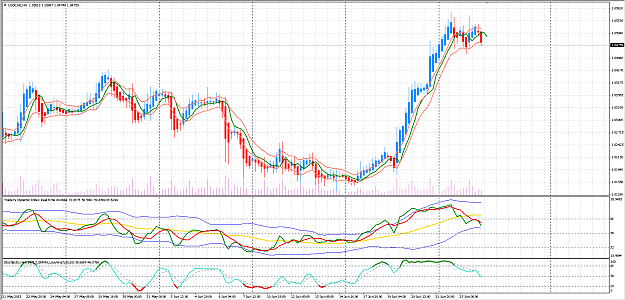
Maybe because you went short while it was at the downside of the trendchannel and because the stochastics was already oversold? Two reasons why you can expect it to go up again, I think.
Trading Made Simple
- Dabbeljoe replied Aug 26, 2013
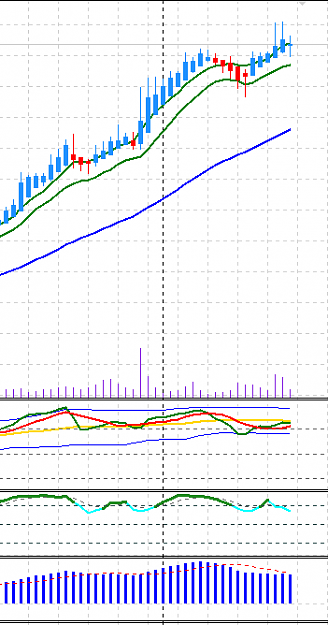
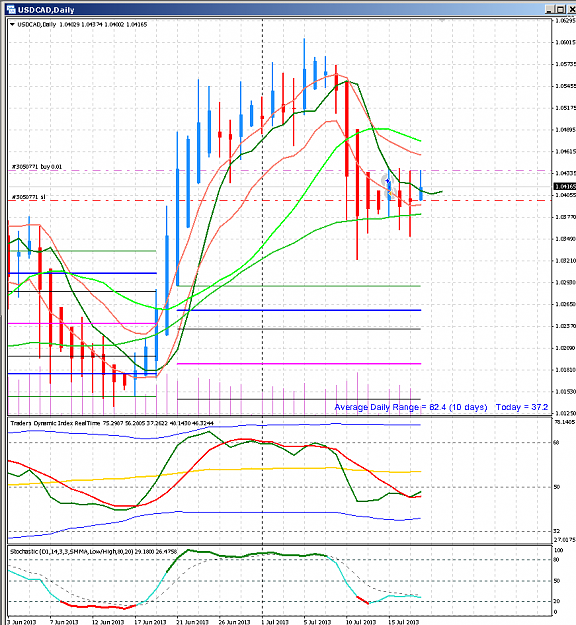
The only cross up that I see on the H4 is the one last friday. But even then it was not a really great move up. If you check on the daily, the trend was going down. I've learned that trading against the trend on the longer TF (daily here) is very ...
Trading Made Simple
- Dabbeljoe replied Aug 22, 2013
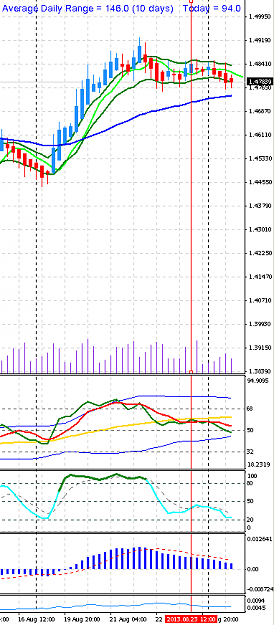
If yopu check the same chart now and compare it with the chart I posted 13 minutes ago, you'll see that the green line is repainting. There is no crossing or near crossing now. It can change again, but that's why you'll need to wait until the bar is ...
Trading Made Simple
- Dabbeljoe replied Aug 22, 2013
Do you want to sell because green crosses red down? I would wait for a while to see if it's not a retracement while the trend is still up. Maybe if the PA breaks the lower line of the PAC.
Trading Made Simple

- Dabbeljoe replied Jul 18, 2013
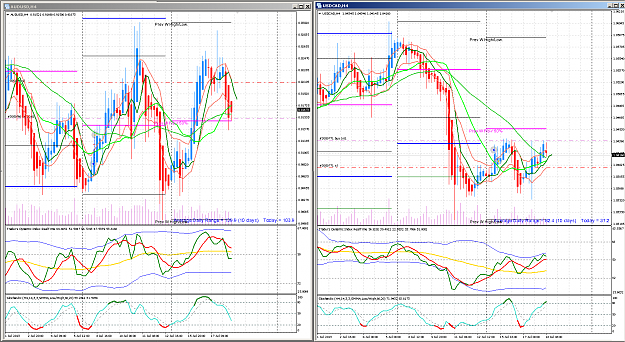
I made pics of your chart and mine, but I don't think they are the same! Am I comparing different charts?? Anyway, I will look at the compassfx video's again, I think I need to go back to school. But I do know what I'm doing wrong is looking at the ...
Trading Made Simple
- Dabbeljoe replied Jul 18, 2013
Oke, this is very educative. Wat I did is check on the daily and saw PA go up and TDI too. How come your chart is different? Bars can be different, but your TDI is still above red? Mine just crossed above. About entering in H4 atm; I did check it on ...
Trading Made Simple
- Dabbeljoe replied Jul 18, 2013
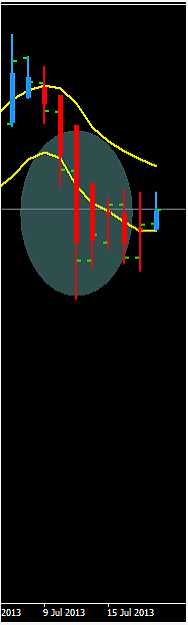
I'm in trouble. The last sixthousand trades (oke, a little less) are losers, and I have no idea what i'm doing wrong. Can anybody help me? The last two trades i started are in the picture. They are both +/- 20 pips down, and I thought they were good ...
Trading Made Simple
- Dabbeljoe replied Jul 18, 2013
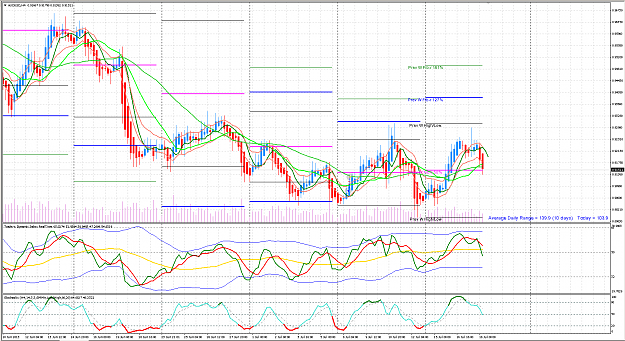
Looking good Emannuel, I'm very interested in this one. Thanks a lot for sharing this whit us! I was also looking for the average weekly range lines that you have in your chart, but I can't find it. Wat is the name of the file, so I can find it in ...
Trading Made Simple
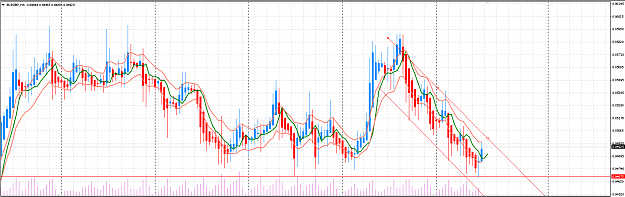
- Dabbeljoe replied Jun 26, 2013
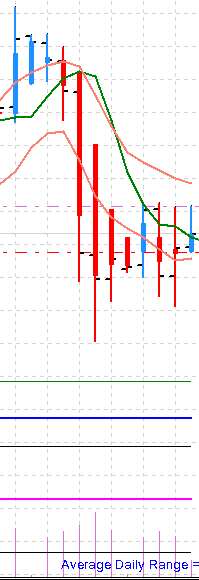
I see a downtrend and a channel in which it can go up for a few pips, but the overall trend is down. The support is at about 25 pips down, but how strong is it? I didn't buy it. Maybe sell if it goes up and reverses?
Trading Made Simple
- Dabbeljoe replied Jun 26, 2013
In 30 min. the candle will close, if the green line is still going down and approaching the 50, passed the yellow line, would you guys go short here? On the D1 it seems to reverse down too and on lower tf's it looks oke too. No SR in the way, at ...
Trading Made Simple
- Dabbeljoe replied Jun 24, 2013
I got a tip from a friend who tried to download the indicators on this website but the indicators aren't working properly. Does anybody have this indicators? I can't find them anywhere. It's the synergy_continuation.mq4, the synergy_MTF.mq4, the ...
Trading Made Simple
- Posts by Member Search: 'Dabbeljoe'