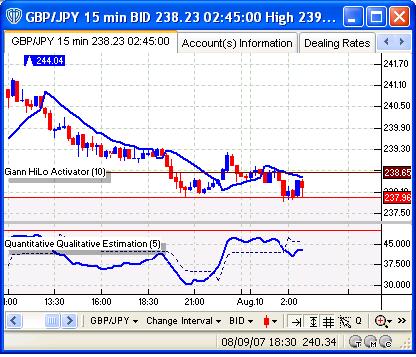
I am trying see where SI is crossing 50 (in the lower time charts 30/15) that everyone is talking about. I don't seem to find it crossing this 50 line since yesterday during that slide down from 243. Coudl someone please see my chart here and tell ...