- Search Forex Factory
- 145 Results (8 Threads , 137 Replies )
- zebulon replied May 2, 2013
Test en direct de la méthode, +42 pips à l'aller et + 42 pips au retour ! testing live the method, +42 pips on the way up and + 42 pips on the way down !
Frog's method
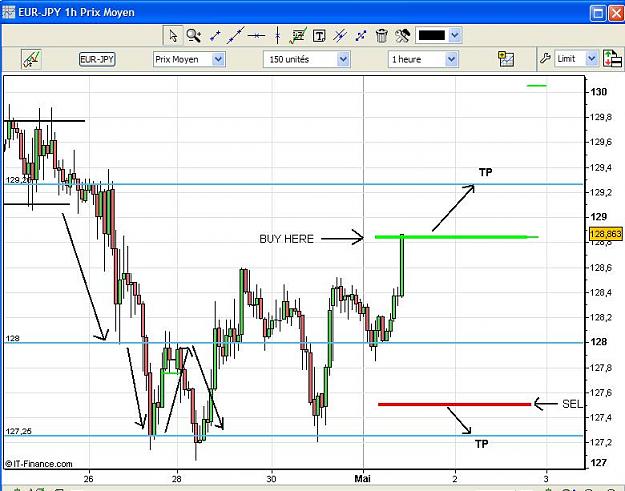
- zebulon replied May 1, 2013
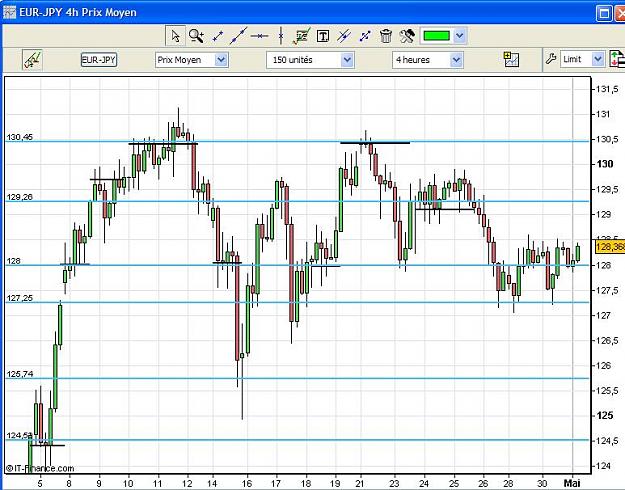
Mon niveau d'achat vient d'être atteint. En route vers les 129.26 My Buy level has just been reached. So let's go to 129.26
Frog's method
- zebulon replied May 1, 2013
Laissons le prix nous indiquer la direction qu'il va prendre. Let's the price tell us where he will go.
Frog's method
- zebulon replied May 1, 2013
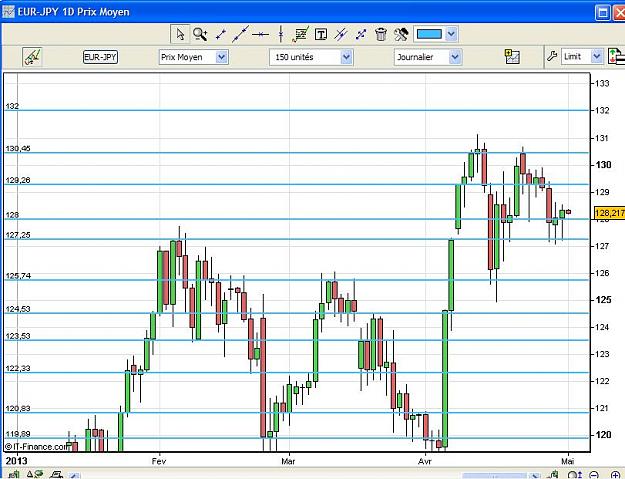
To draw the lines, i use first daily Time frame. And i draw on the body of the candles. These lines can be adjusted or confirmed on 4H time frame.
Frog's method
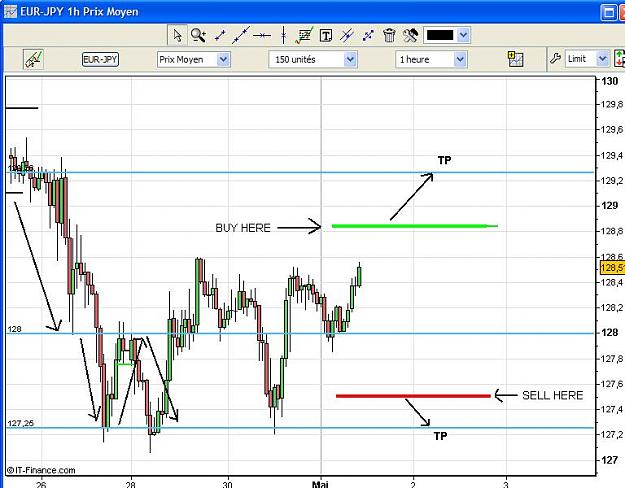
- zebulon replied May 1, 2013
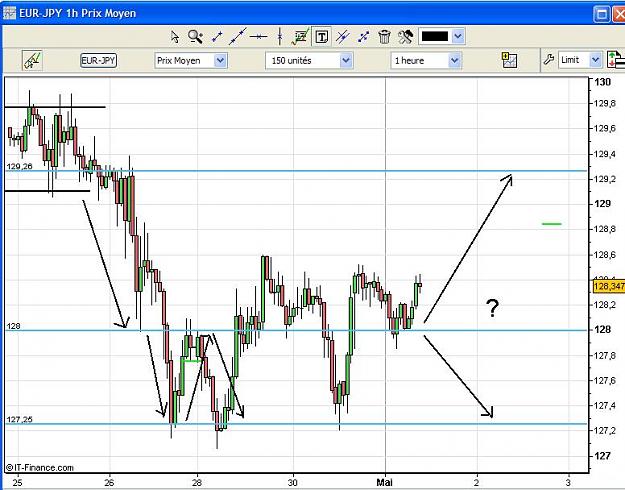
Alors que va t-il arriver maintenant ? Le prix va monter, descendre ? Je n'en sais rien. So what will hapen now ? The price will go up or down ? i don't know.
Frog's method
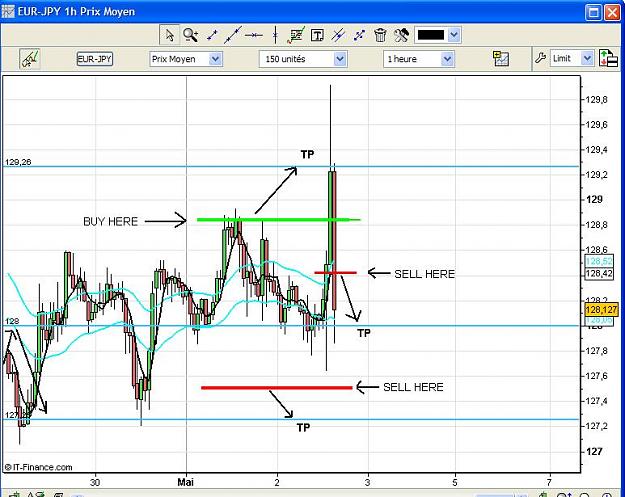
- zebulon replied May 1, 2013
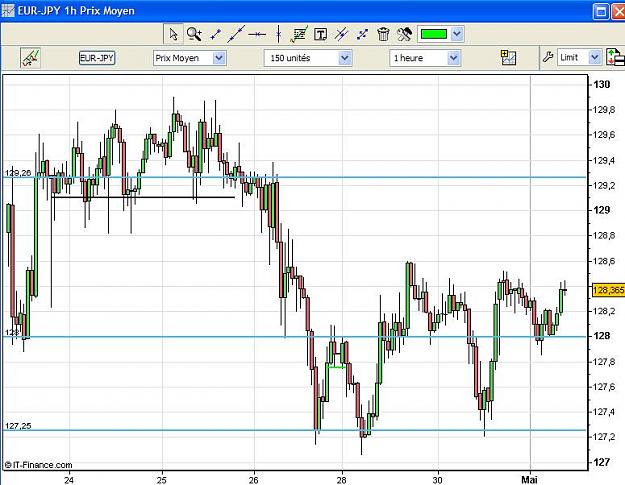
regardez les prix osciller autour des 129.26, puis bondir sur les 128 et ensuite 127.25 Look at the price oscillating around 129.26, and bounce to 128 and 127.25
Frog's method
- zebulon replied May 1, 2013
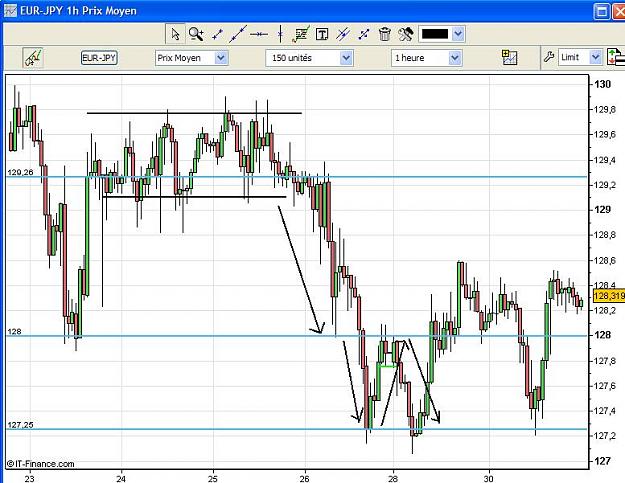
zoomons encore avec un graphique 1H. Les grenouilles bondissent de ligne en ligne. Let's zoom again with a 1H chart. Frogs are jumping from a line to another.
Frog's method
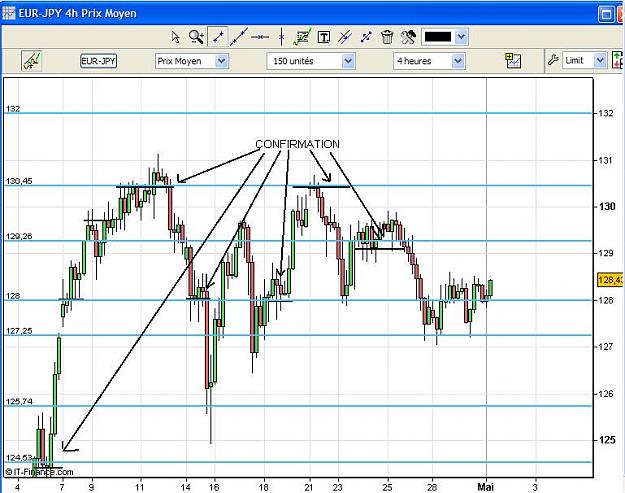
- zebulon replied Apr 30, 2013
Bien sur que non. Nous allons voir comme il est intéressant de dessiner des lignes de support et de résistance en journalier. Of course no. We will see how it is interresting to draw support and resistance lines.
Frog's method
- Frog's methodStarted Apr 30, 2013|Trading Systems|31 replies
Ceci est une méthode bilingue qui n'est animé que par un seul indicateur : le bon sens. Que voyez ...
- zebulon replied Feb 21, 2012
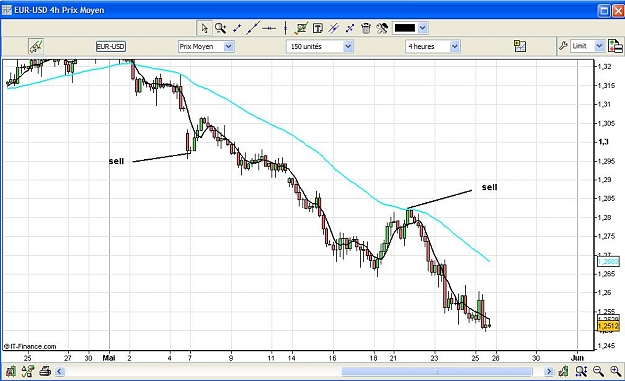
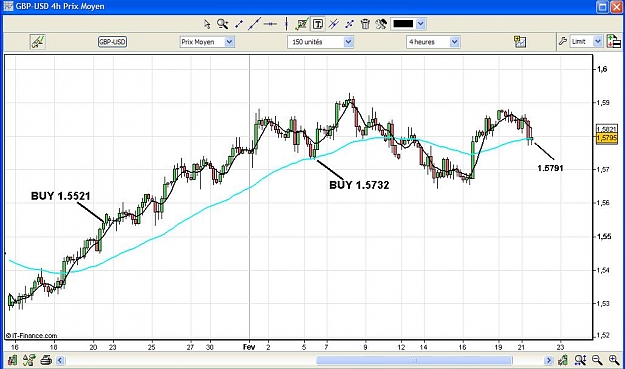
I look history, the short entry is a mistake as the long entry at 1.5732 is still open. If i have missed it, i would enter at the touch of EMA 50 at 1.5791
Dancing with EMA
- zebulon replied Feb 20, 2012
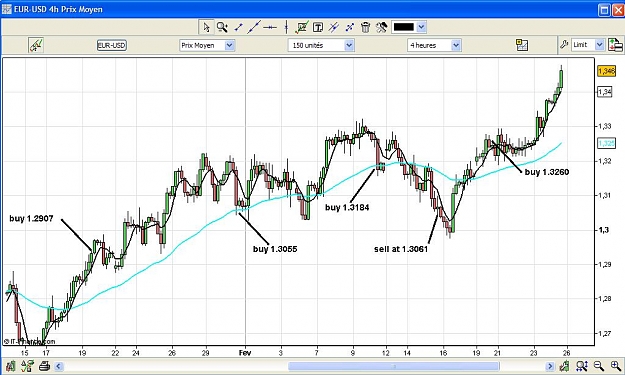
EUR/USD : i'm long now at 1.3260 since the candle has closed more than 100 pips from 50 EMA
Dancing with EMA
- zebulon replied Feb 14, 2012
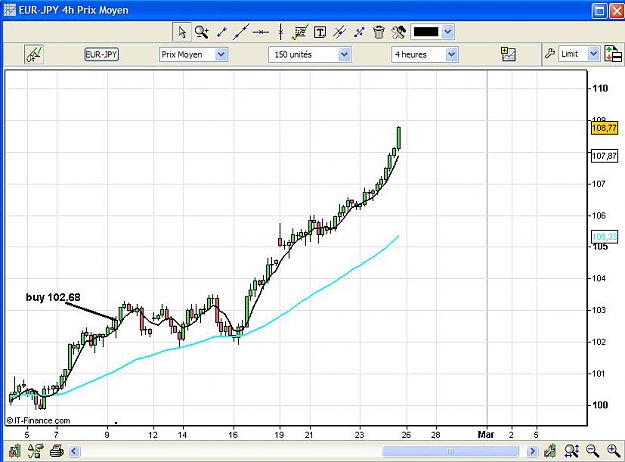
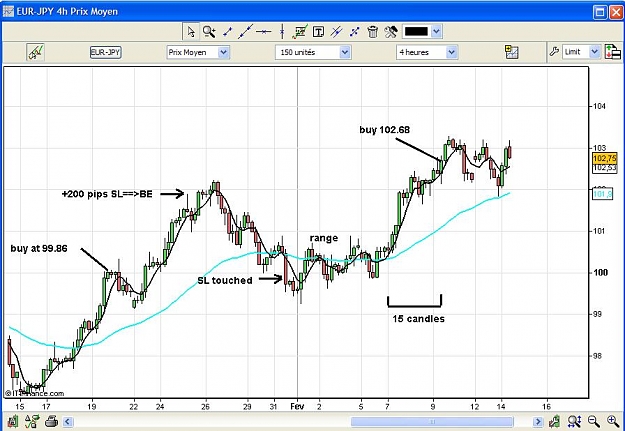
EUR/JPY : buy at 99.86, when price was 200 pips up, i have moved SL to BE. SL touched at BE. After a range period (5 EMA cross 3 times 50 EMA), i have wait for 15 candles before buying at 102.68. Hope this can help !!
Dancing with EMA
- zebulon replied Feb 14, 2012
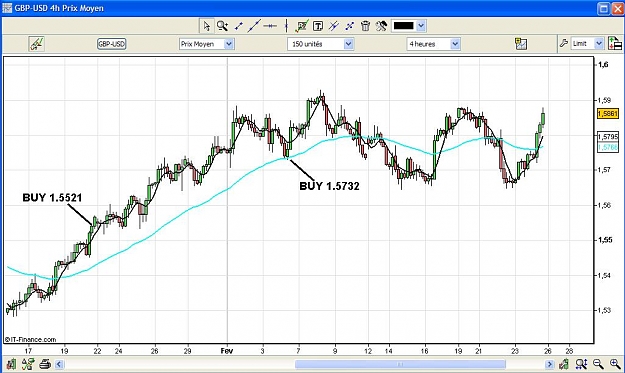
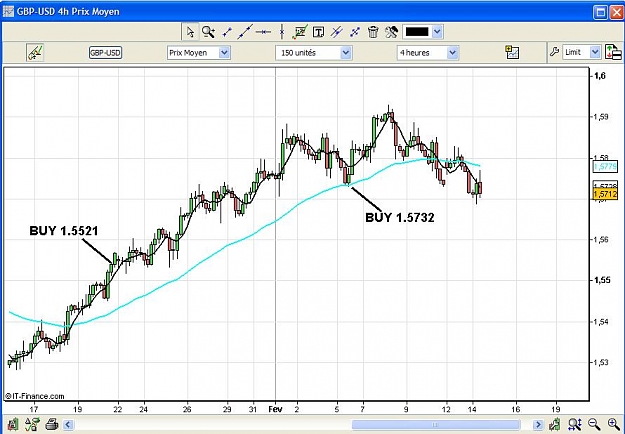
GBP/USD : 2 trades open at 1.5521 and 1.5732. No SL has been touched
Dancing with EMA
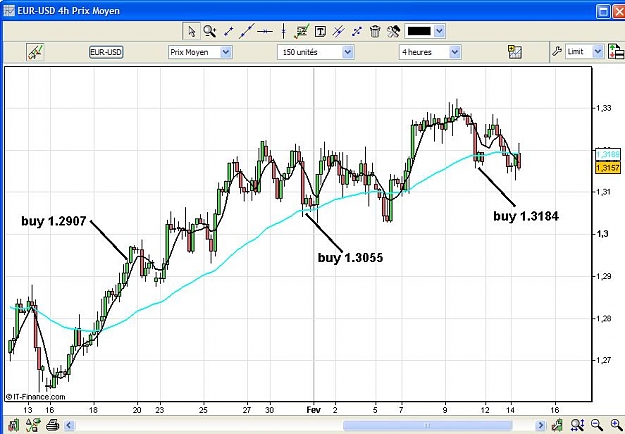
- zebulon replied Feb 14, 2012
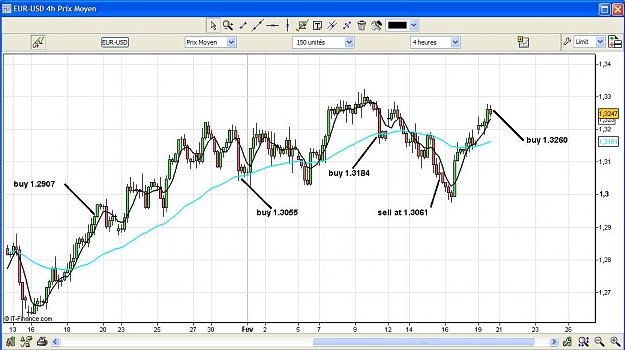
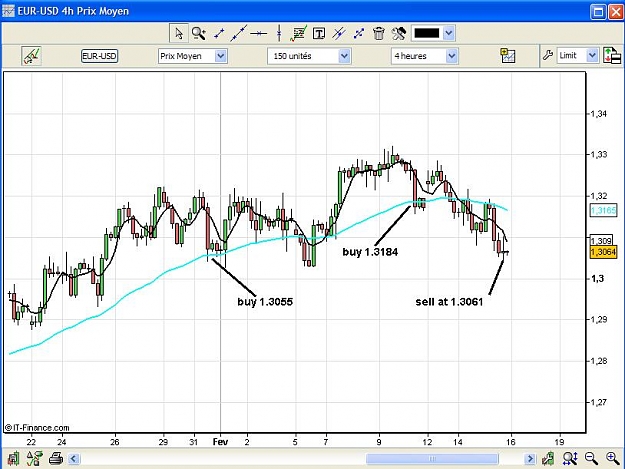
Here are the trades from the beginning of 2012 : EUR/USD : 3 open trades at 1.2907, 1.3055 and 1.3184, no SL has been touched
Dancing with EMA