- Search Forex Factory
- 12 Results (1 Thread , 11 Replies )
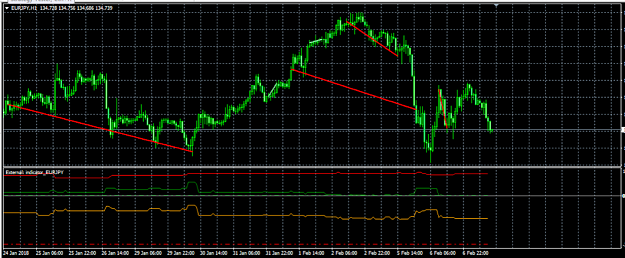
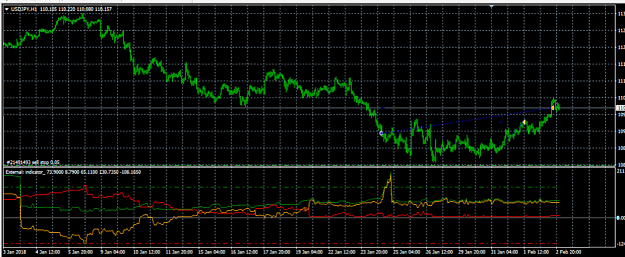
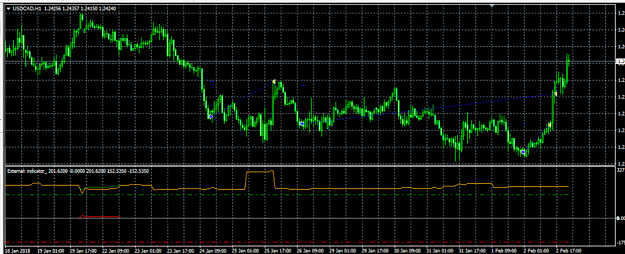
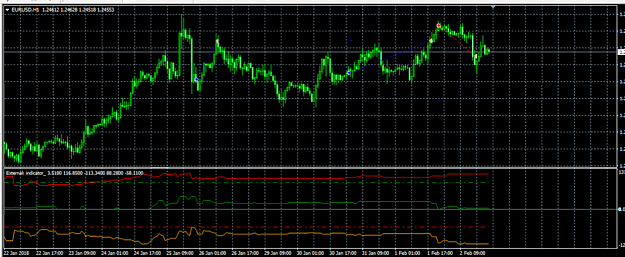
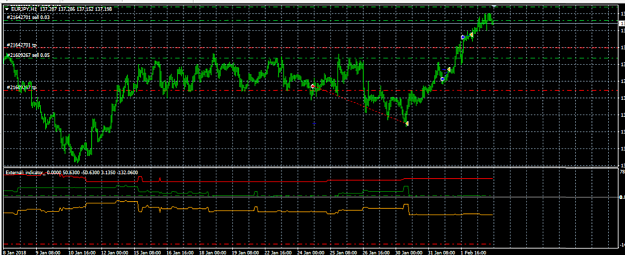
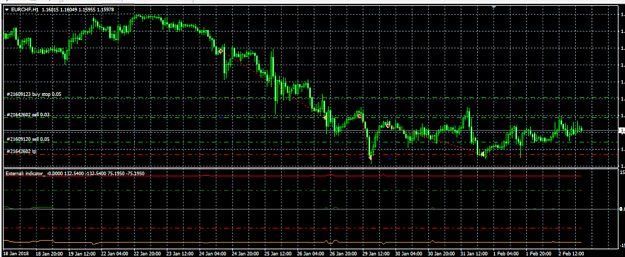
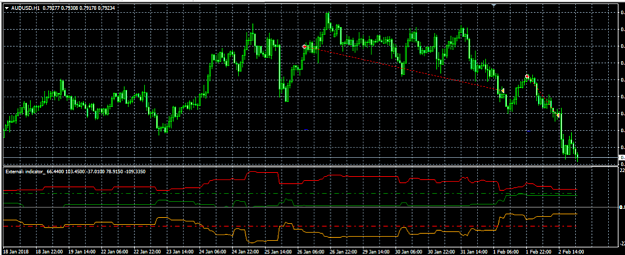
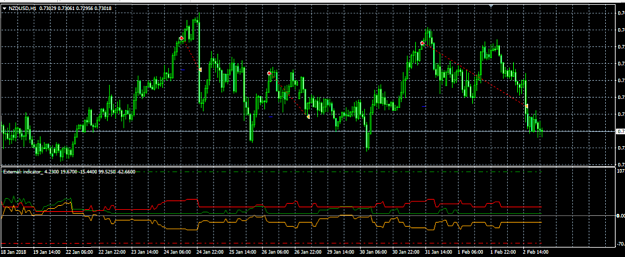
- truelifeajf replied Feb 9, 2018
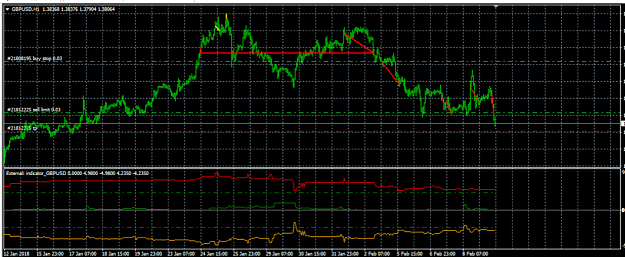
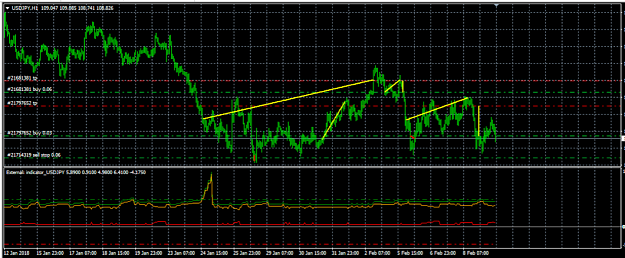
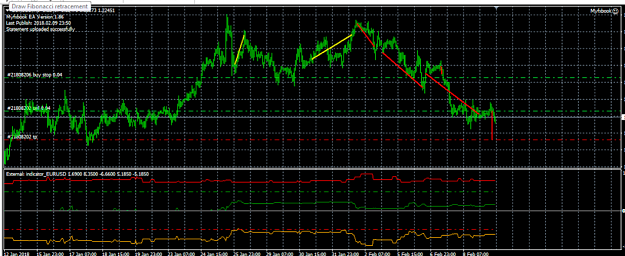
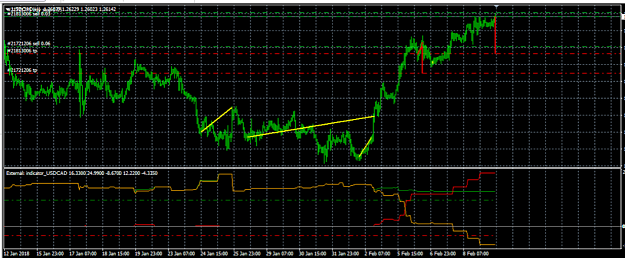
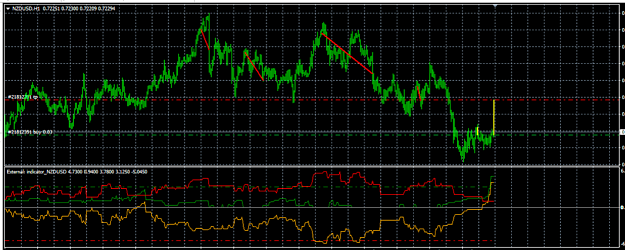
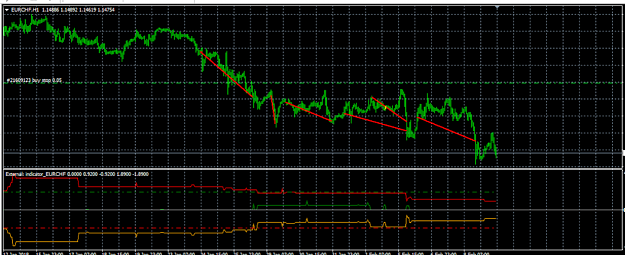
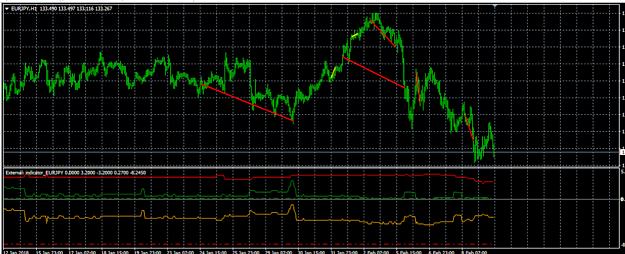
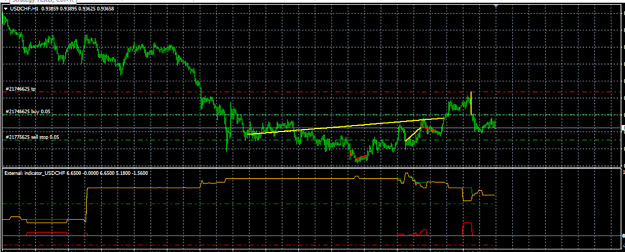
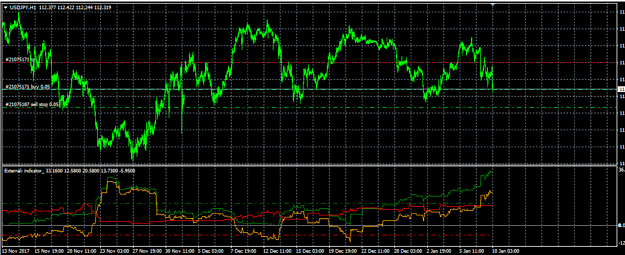
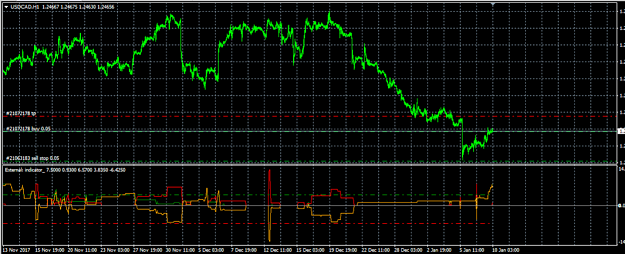
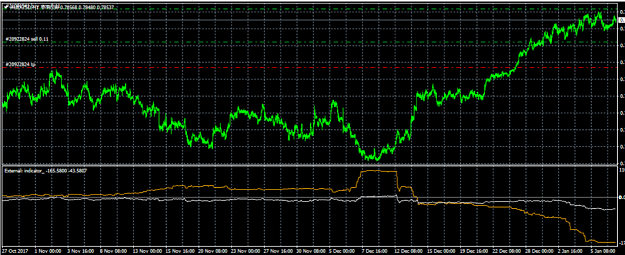
Profit this week: url $600 on $5k = 12% $400 DD at the moment. Screen shots attached showing closed trades, and open trades (line between open price and TP price) yellow = buy red = sell blue = ignore those - they're my automated hedge trades ...
What do people think of this indicator?
- truelifeajf replied Feb 7, 2018
Myfxbook page set up for this account / trading strategy: url and if people want to see trades I've taken with the indicator as well, let me know. Example attached.
What do people think of this indicator?
- truelifeajf replied Feb 3, 2018
I don't know if anyone is listening or whatever, but for my own analysis I said I'd post my trades using my indicator and I haven't really done that. It's because I wanted to open a new $5k account just to test trading with this indicator, which ...
What do people think of this indicator?
- truelifeajf replied Jan 9, 2018
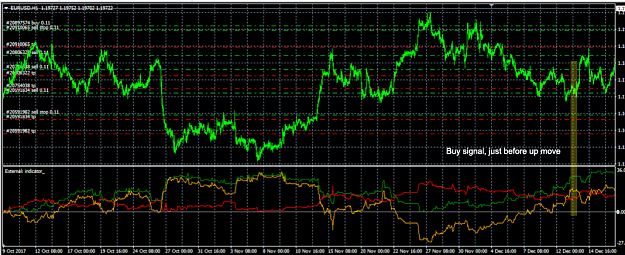
Anyone know why I can no longer edit my posts, even a post made a few minutes ago? New trade: based on buy signal from indicator. The indicator is giving a fair amount of sell signal which isn't ideal. I prefer it when there's no sell signal and ...
What do people think of this indicator?
- truelifeajf replied Jan 9, 2018
Ok, well I hate showing people my trades but I'm putting pride in my pocket and here's a trade I took a few hours ago. As mentioned, I think my biggest problem is setting entry and exits. I generally (and in this case) just set a SL (well, a hedge) ...
What do people think of this indicator?
- truelifeajf replied Jan 9, 2018
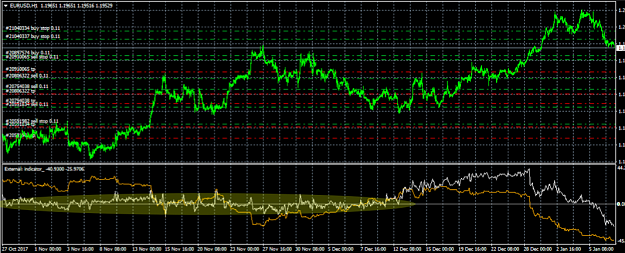
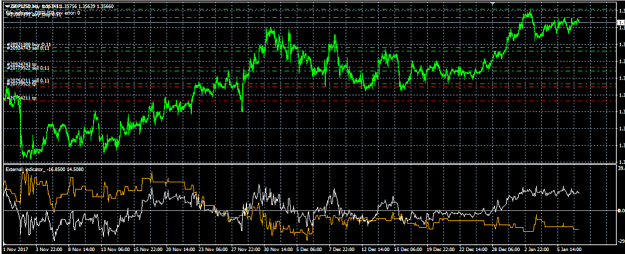
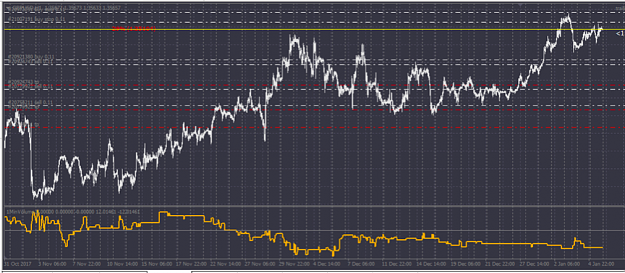
You picked two charts that happened to have a high correlation over the last couple of months. I added a plot of correlation (white line) to EURUSD and yes, for all of November the indicator line, when inverted is closely correlated to the price. ...
What do people think of this indicator?
- truelifeajf replied Jan 7, 2018
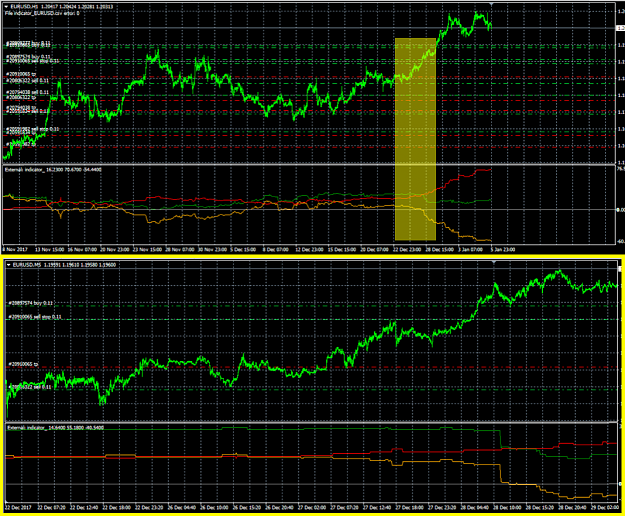
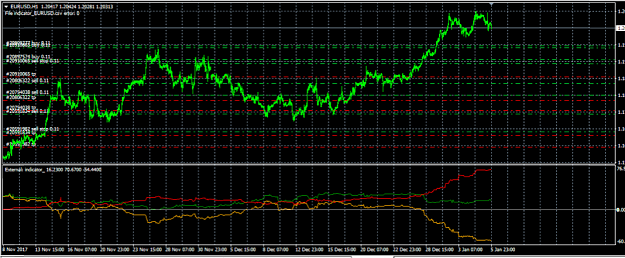
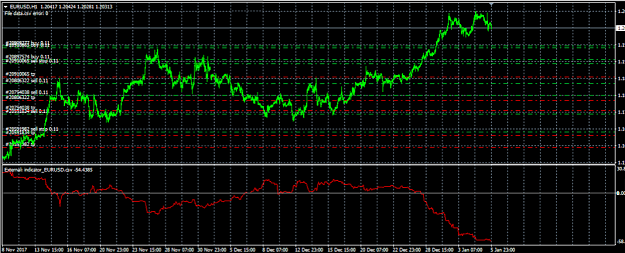
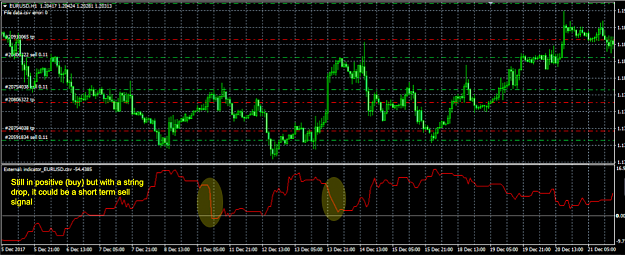
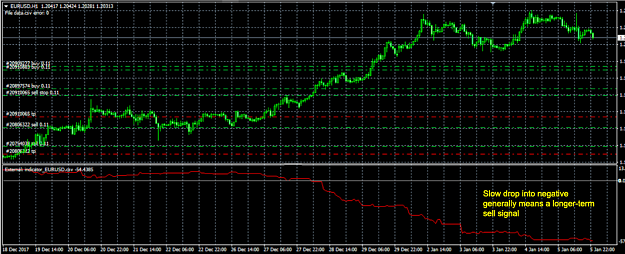
I've modified my indicator to show the buy line, sell line, and then the final line (= buy minus sell). This helps to show the reason why, for example, the final line is in negative... is it because of lack of buy signal? lack of sell signal? maybe ...
What do people think of this indicator?
- truelifeajf replied Jan 7, 2018
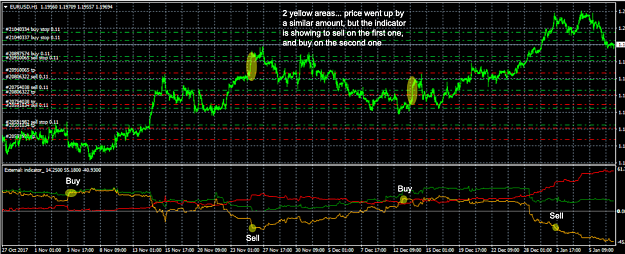
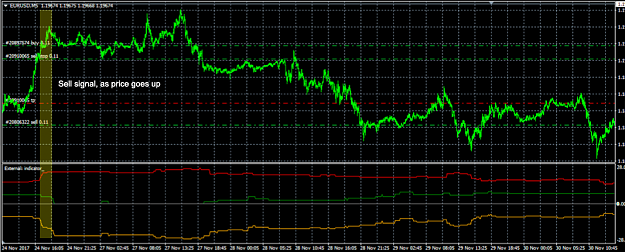
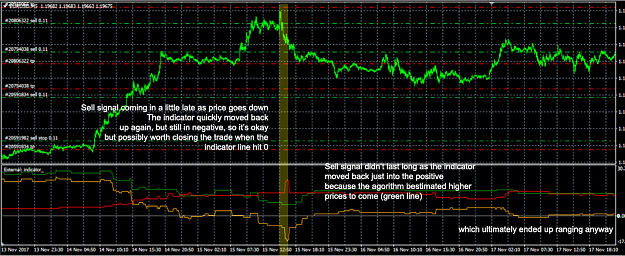
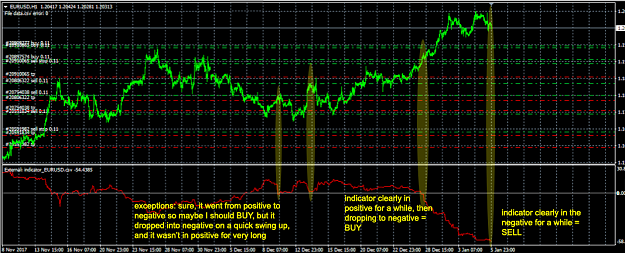
ForeverNewb... ah, now I see what you're doing. Well, it does appear that just as the line crosses from positive to negative, it would have been a good time to BUY, even though going into negative actually is a SELL signal. That's an interesting ...
What do people think of this indicator?
- truelifeajf replied Jan 7, 2018
I've modified Plot External Data.mq4: I couldn't work out why you used: int h = FileOpen(FileName, FILE_CSV|FILE_READ,'~');... why "~" ? I made it use "," Checks for errors using GetLastError() after attempting to open the file No timestamp ...
What do people think of this indicator?
- What do people think of this indicator?Started Jan 6, 2018|Trading Discussion|41 replies
Hi all, I rarely use forums, I've traded for a number of years and experienced the usual ups and ...
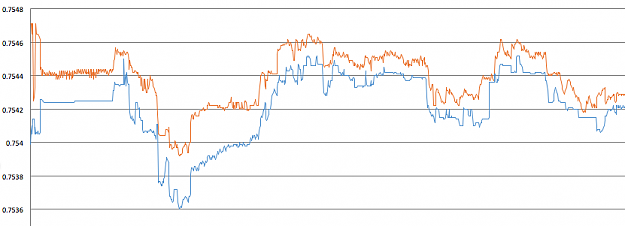
- truelifeajf replied Apr 7, 2016
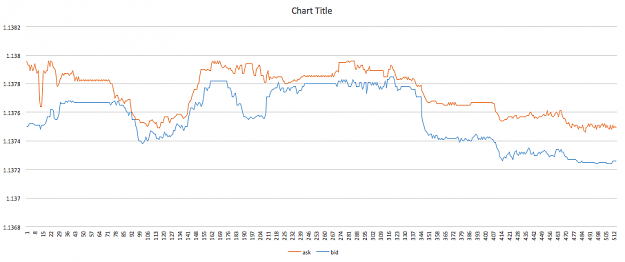
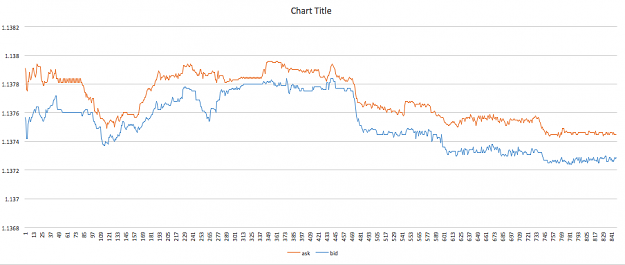
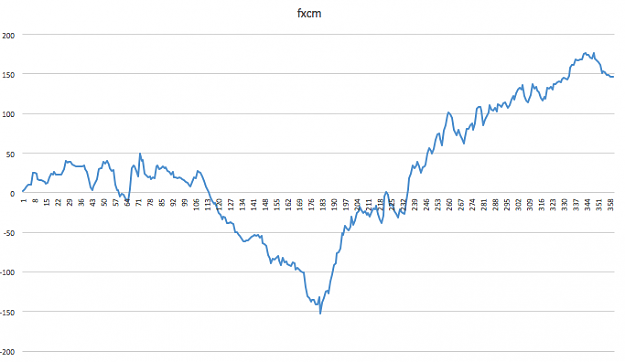
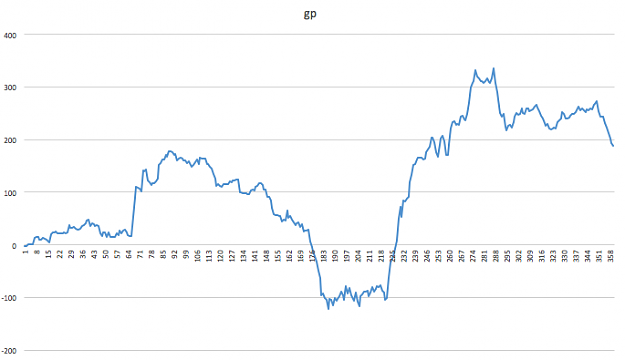
Here's a tick chart for a 6 hour period on EURUSD starting today. The differences in bid / ask are really quite varied between brokers. Global Prime had 27,700 ticks whereas FXCM had 12,240 ticks. That's a big difference. The two charts don't share ...
Delta Volume - Cumulative Delta Volume
- truelifeajf replied Apr 7, 2016
Of course spread can widen with the bid going down as well... but again, I'm just picking one example to avoid confusion. Attached is a screen shot of the spread at the very start of yesterday. Firstly the ask went up considerably more than the bid ...
Delta Volume - Cumulative Delta Volume
- Posts by Member Search: 'truelifeajf'