- Search Forex Factory
- 68 Results
- traderblah replied Sep 14, 2017
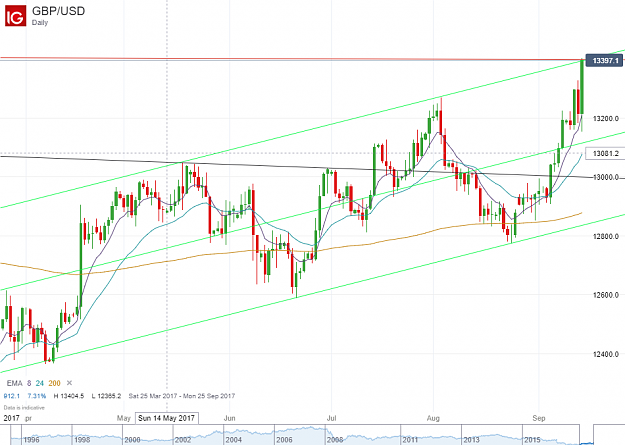
The chart red line was drawn in a couple of months ago before the above quote. Its the base line for a massive head and shoulders. The green line is a recent channel up
Cable Update (GBPUSD)

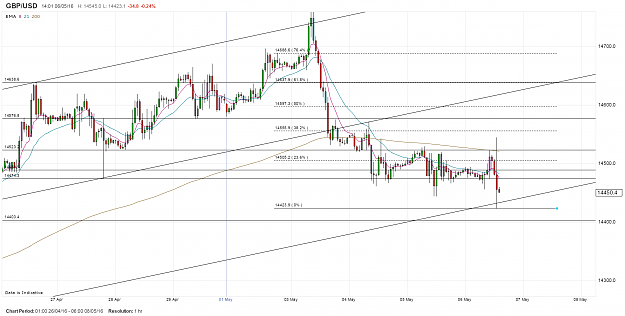
- traderblah replied Jun 16, 2016
Revisiting lows tomorrow? H&S left shoulder formed on 13 June and today failed to pass top of cloud
Carpe diem: Intraday tactics for Dax and Dow

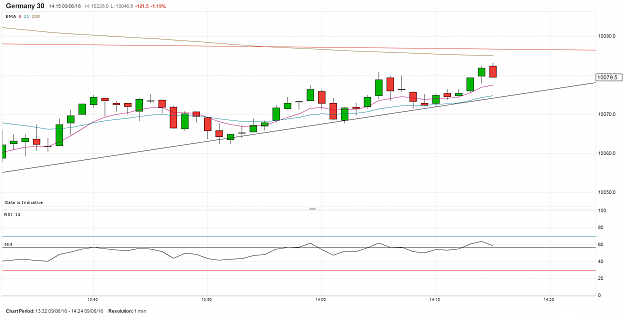
- traderblah replied Jun 15, 2016
Looking for the 3rd peak with lower high on momentum
Carpe diem: Intraday tactics for Dax and Dow
- traderblah replied Jun 9, 2016
I've utilised your 15 chart and taken a tram line equidistant below (red line). Looking to short at 200ema on minute chart
Carpe diem: Intraday tactics for Dax and Dow
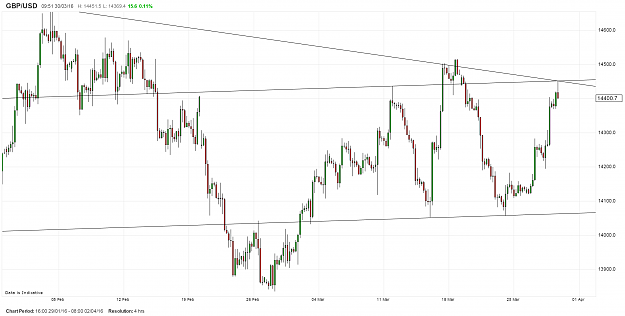
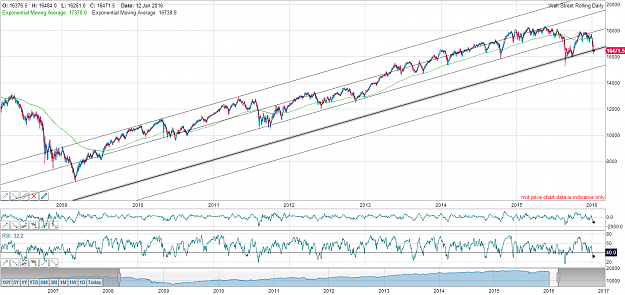
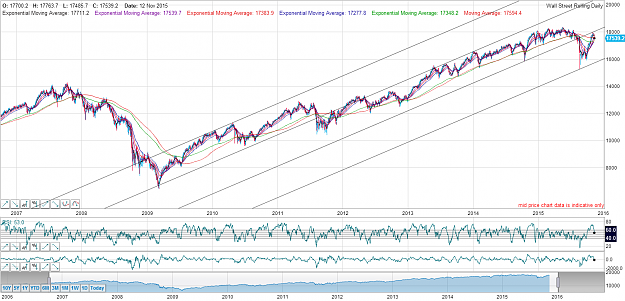
- traderblah replied Mar 30, 2016
I note talk of an inverse head & shoulders but is not the monthly depiction going back years one massive head & shoulders. Also one seems to have formed on the 4 hour timeframe
Cable Update (GBPUSD)
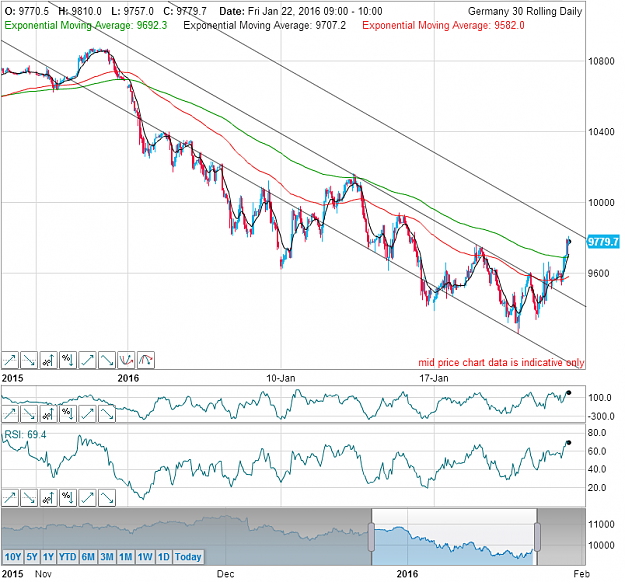
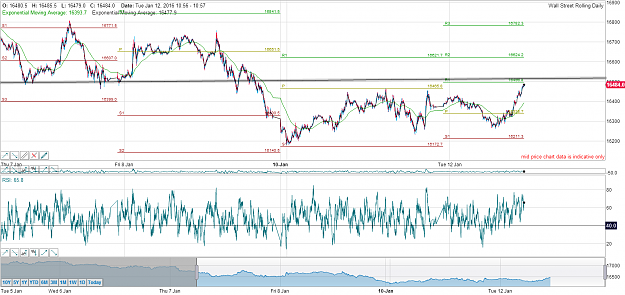
- traderblah replied Jan 22, 2016
Oh well maybe not 9773 - bounced off R1 heading for R2 R2 9852.4 R1 9709.0 PP 9522.1 S1 9378.7 R2 at my tramline equidistant with lower 2
Carpe diem: Intraday tactics for Dax and Dow
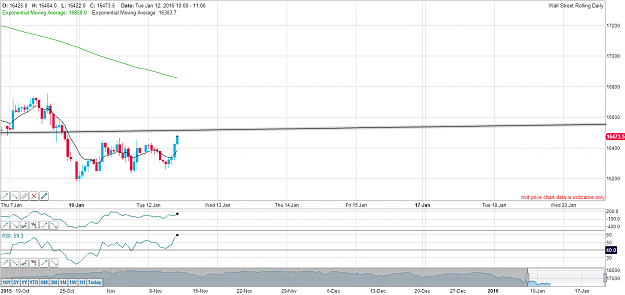
- traderblah replied Jan 12, 2016
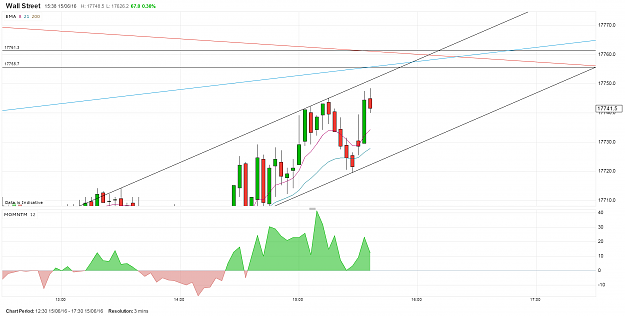
I see a short on DOW cash in the region of 16510
Carpe diem: Intraday tactics for Dax and Dow
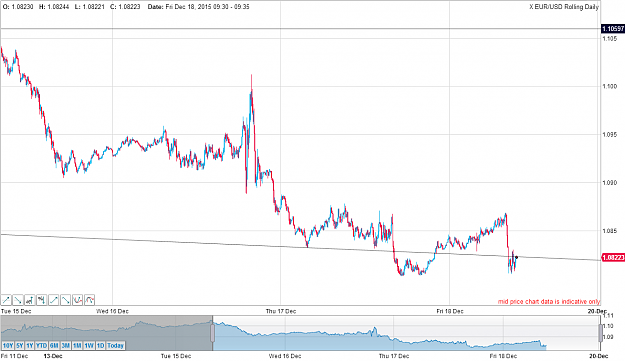
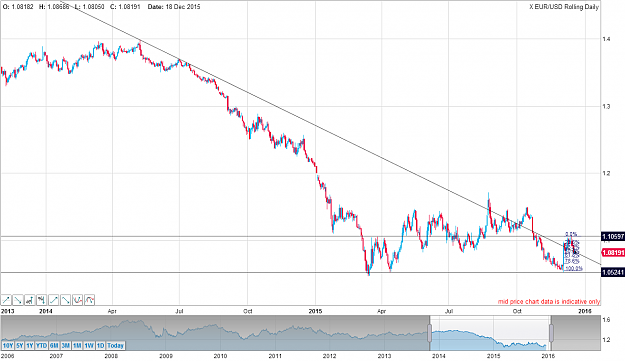
- traderblah replied Dec 18, 2015
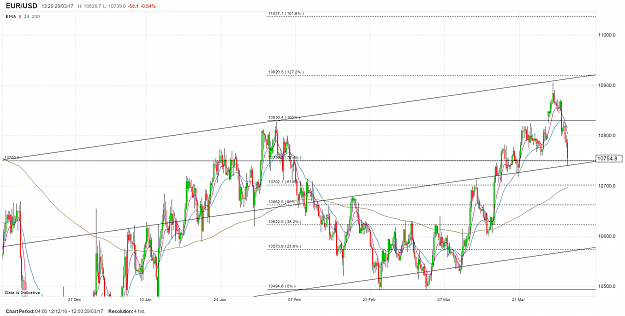
Euro caught between 50% fib retrace and long time tendline
Carpe diem: Intraday tactics for Dax and Dow
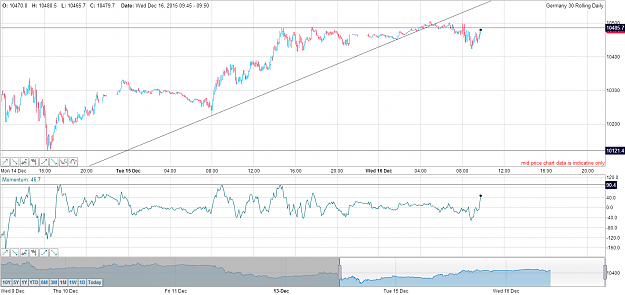
- traderblah replied Dec 16, 2015
Is this the top - DAX cash
Carpe diem: Intraday tactics for Dax and Dow
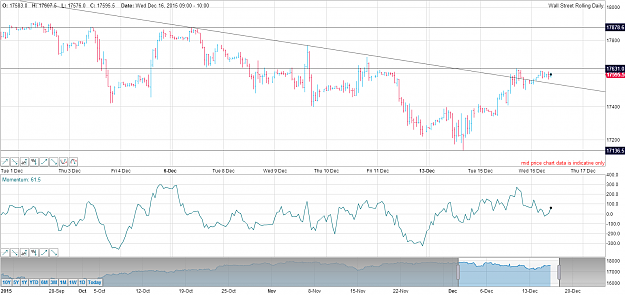
- traderblah replied Dec 16, 2015
Just noticed DOW cash retrace exactly 2/3rds of the down
Carpe diem: Intraday tactics for Dax and Dow
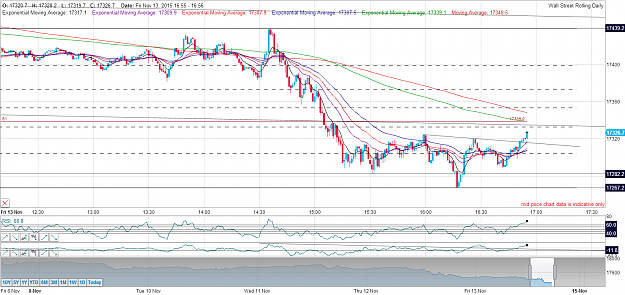
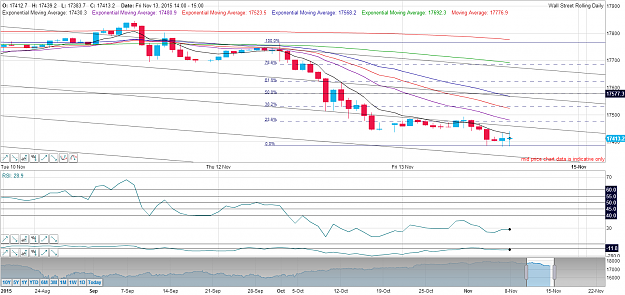
- traderblah replied Nov 13, 2015
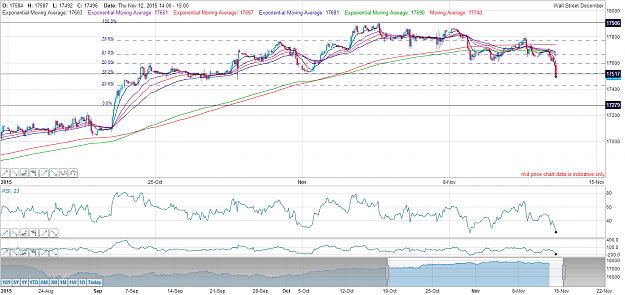
Target 50 ema on the hourly near 50% fib with positive divergence and near tramline. Long 17400
Carpe diem: Intraday tactics for Dax and Dow

- traderblah replied Nov 12, 2015
If not going beyond 17510 then possible targets
Carpe diem: Intraday tactics for Dax and Dow

- traderblah replied Nov 12, 2015
Do I or don't I down or up
Carpe diem: Intraday tactics for Dax and Dow

- traderblah replied Nov 12, 2015
Did someone post a chart like this. Can't find it so have tried to emulate from memory
Carpe diem: Intraday tactics for Dax and Dow
- traderblah replied Nov 12, 2015
Posted similar charts. DOW cash down to 17279 then up to 17517
Carpe diem: Intraday tactics for Dax and Dow