- Search Forex Factory
- 18 Results (1 Thread , 17 Replies )
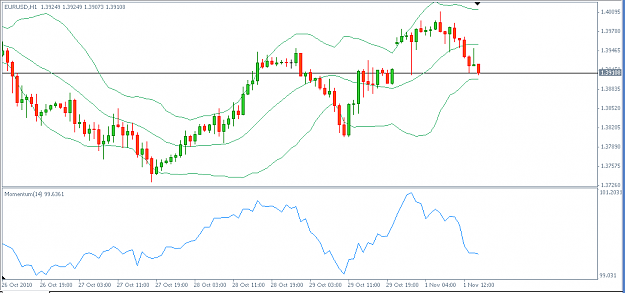
- thefxfanatic replied Nov 1, 2010
image lost momentum; broke today's lows. at support 1.3905; breach of this level will take the price to 1.3885 and then 1.3860
EURUSD
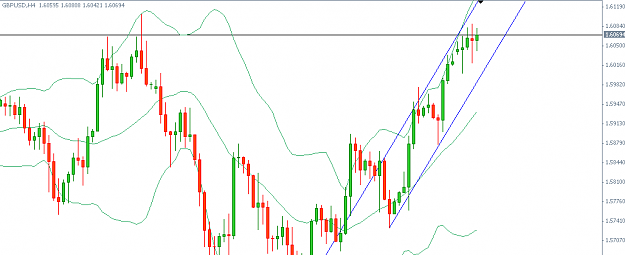
- thefxfanatic replied Nov 1, 2010
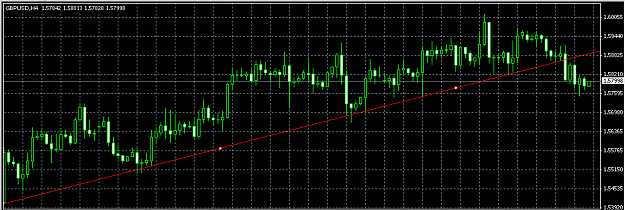
sharp bullish channel. looks like 1.61 is in sight. image
Cable Update (GBPUSD)
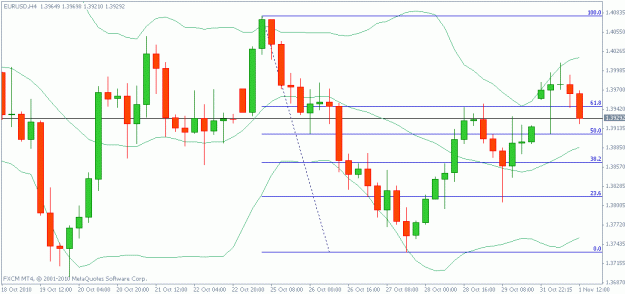
- thefxfanatic replied Nov 1, 2010
image if the current candle closes below 1.3945, we may see a re-test of today's lows which happens to be a good support. below there, supports lie at 1.3885 and 1.3862
EURUSD
- thefxfanatic replied Oct 29, 2010
image in case the price manages to close (4H) below 1.3855, we may see another retest of 1.3805 which happens to be a support level. the pair is going to face resistance at 1.3874. A breach will send the price to 1.3924
EURUSD
- thefxfanatic replied Oct 29, 2010
breather for USD/JPY. the rsi bounced off and is now turning bullish. US open will give us the clear direction. image
USD/JPY Discussion
- Simple Reversal Spotting Trades (MA/Elliott Wave Osc)Started Oct 28, 2010|Trading Systems|1 reply
This is a very simple form of spotting trend reversals and entering into trades. Indicators Used: ...
- thefxfanatic replied Oct 28, 2010
[quote=forextine;4127727]We going to see a drop to 128 in the near term? likely... incase it closes below 128.37, next support is at 128 image
Auslanco - GBP/JPY and GBP/USD (newstrade)

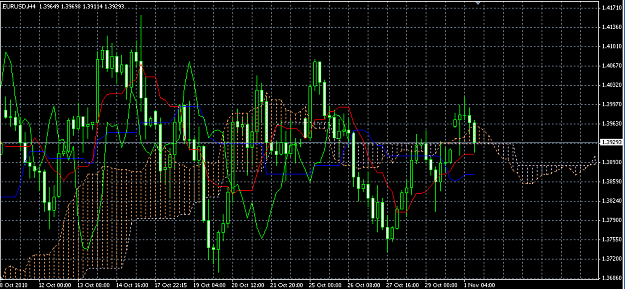
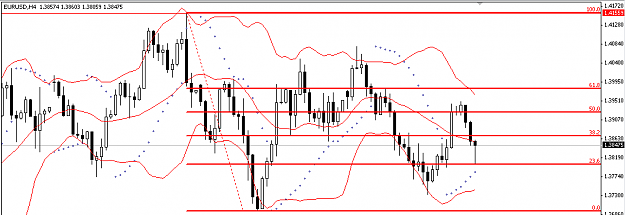
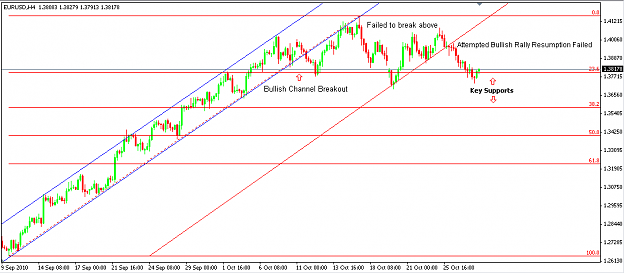
- thefxfanatic replied Oct 28, 2010
image here is a larger E/U picture. first, there was a strong bullish rally, then a breakout of the bullish channel. the pair then failed to make its way back into the bullish channel. 1.3798 and 1.3690 are the key supports.
EURUSD
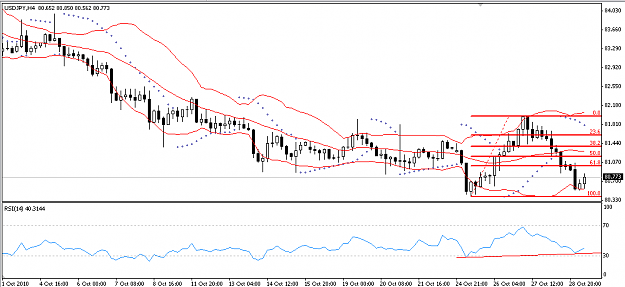
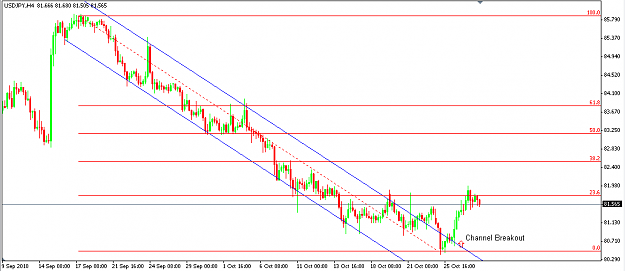
- thefxfanatic replied Oct 28, 2010
bearish channel breakout is seen. currently facing resistance @ 81.76
USD/JPY Discussion
- thefxfanatic replied Oct 27, 2010
Currently at resistance level. Incase of a break out, we could see 113.52. image
EUR/JPY Anytime!
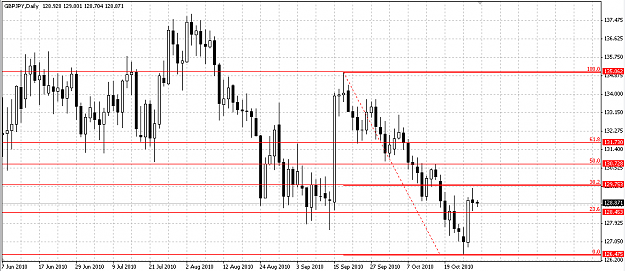
- thefxfanatic replied Oct 27, 2010
Fibo levels for down move from 135.062 to 126.475 128.45 is the level to be watched for critical support. Major resistance lies at 129.75 image
Daily GBP/JPY analysis
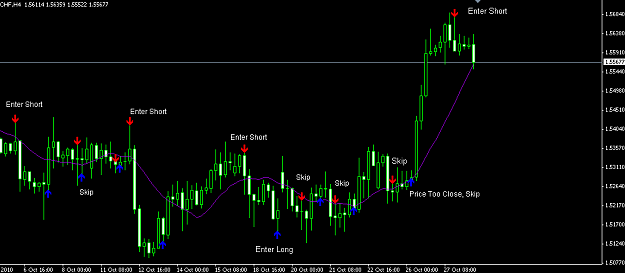
- thefxfanatic replied Oct 27, 2010
Cable stuck between the bulls and the bears. No clear pattern could be seen. Refer the following template; it is very useful in spotting trend reversals. image
Cable Update (GBPUSD)
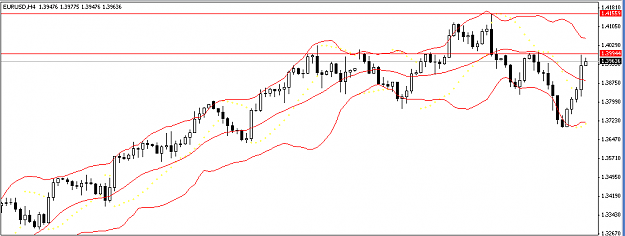
- thefxfanatic replied Oct 20, 2010
EUR/USD is appearing since yesterdays fall. Once the price settles over 1.3994, we may se a retest of 1.4155. image
EURUSD
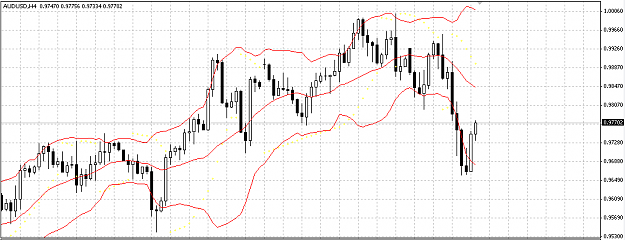
- thefxfanatic replied Oct 20, 2010
Strong bounce off the bottom of last bollinger band. Aiming 0.9850 level. image
AUD/USD
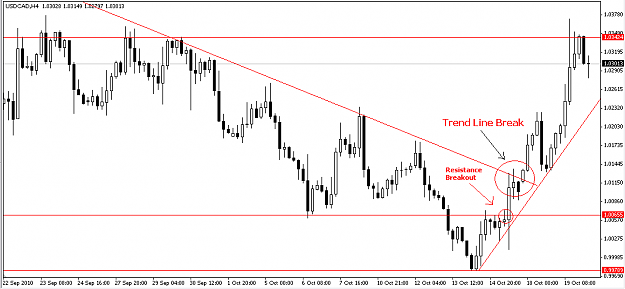
- thefxfanatic replied Oct 20, 2010
Trendline Break — Trendline break suggesting upmove. However, price needs to settle over 1.0342. image
USDCAD trend reversal?
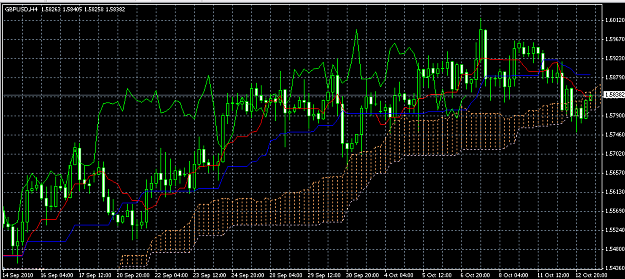
- thefxfanatic replied Oct 13, 2010
image KUMO of the ichimoku clouds supported G/U. Currently, the price is at Tekan. Next level to watch is 1.5888 where the Kijun is present. All in all, appears to me as though the pair is looking to test this week's high @1.596
Cable Update (GBPUSD)
- thefxfanatic replied Oct 12, 2010
Valid trend line break? — image Looks like this is a valid recent trend line break on 4 hours chart. Comments please..
Cable Update (GBPUSD)
- Posts by Member Search: 'thefxfanatic'