- Search Forex Factory
- 20 Results
- priceact.fx replied Sep 10, 2019
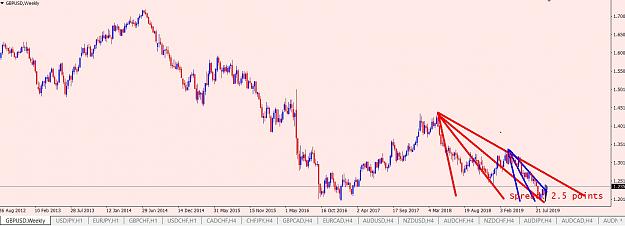
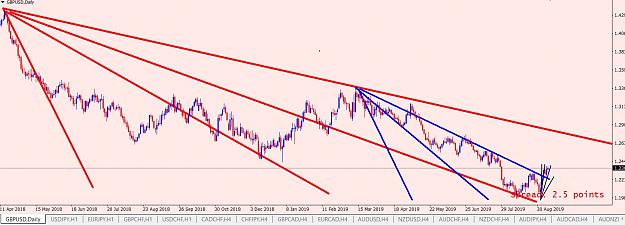
Thank you, parisboy. I started looking into using 50% (and 50% of 50%) angles. When drawn on Weekly, Daily, Hourly charts, they indicate the turning points and S/R levels pretty well and in advance. Below are the charts for GBPUSD (Weekly - Red, ...
Time and Price Forecasting
- priceact.fx replied Sep 8, 2019
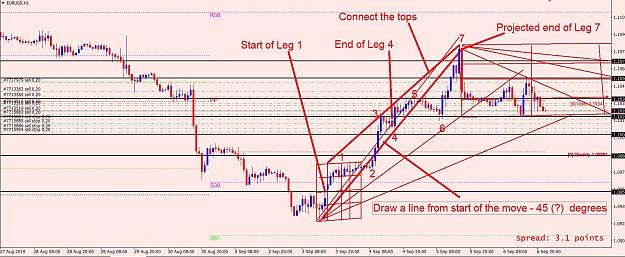
Thank you for going through the post. Following is my approach to find the Price, Time confluence / projected end of leg 7 based on the starting of the leg 1 and projected end of leg 4 (b.t.w, these can change and we need to re-evaluate as the ...
Time and Price Forecasting
- priceact.fx replied Sep 8, 2019
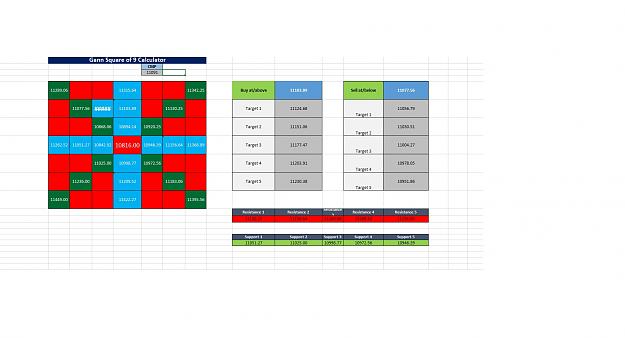
I had been trying (seeing inconsistent results) for the past decade or so. I am seeing better results now - Gann's methods definitely give us the edge. Potential price turning points can be plotted ahead using Gann's Square of 9 method (Horizontal ...
Time and Price Forecasting
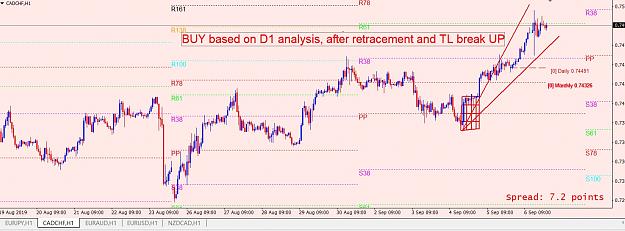
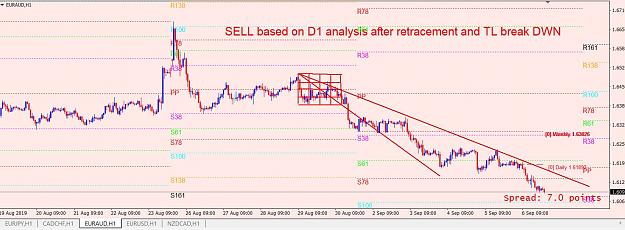
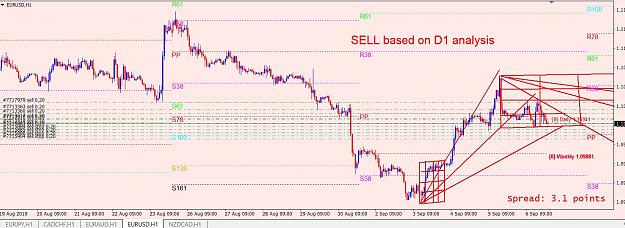
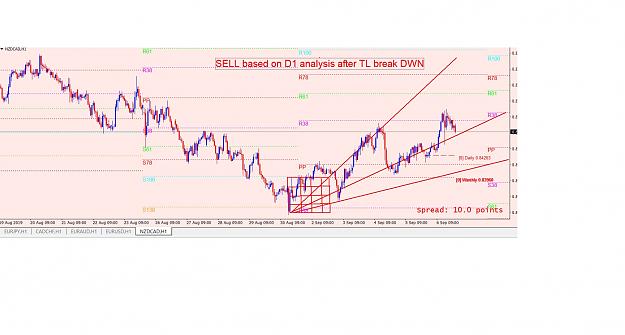
- priceact.fx replied Sep 7, 2019
Following trades have a good potential on H1 (with analysis done on Monthly, Weekly, Daily TF's and also drawing the Gann Square and the corresponding trend lines through the square): EURUSD : SELL EURAUD : SELL EURJPY : SELL CADCHF : BUY NZDCAD : ...
Time and Price Forecasting
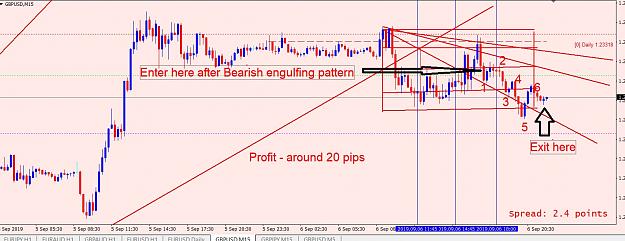
- priceact.fx replied Sep 6, 2019
Exit GBPUSD (profit is around 20 pips). Gann's methods along with geometric patterns shared by Pete are very effective. More practice leads to better and consistent results. image Thank you, Pete.
Time and Price Forecasting
- priceact.fx replied Sep 6, 2019
I took a sell on GBPUSD on M15 and moved the SL to BE at this point - 14 pips in profit. (Did not take sentiment into consideration but checked to be sure - no planned high impact news in near future - just to try and see what happens). Also, the ...
Time and Price Forecasting
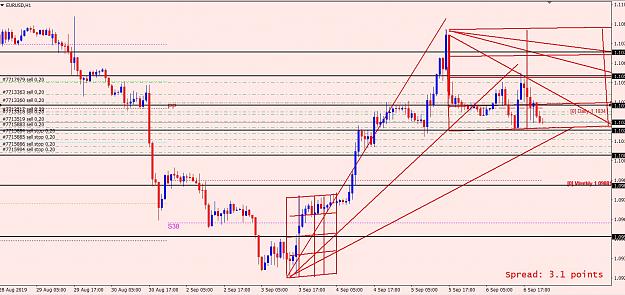
- priceact.fx replied Sep 5, 2019
The earlier chart is for EURUSD on H1 time frame. Following is another for EURUSD but on D1 time frame. image
Time and Price Forecasting
- priceact.fx replied Sep 5, 2019
Thanks, Pete. I tried drawing in MT4. image
Time and Price Forecasting
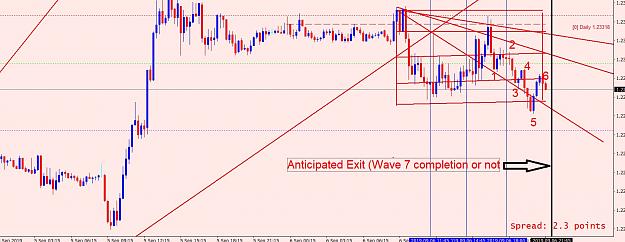
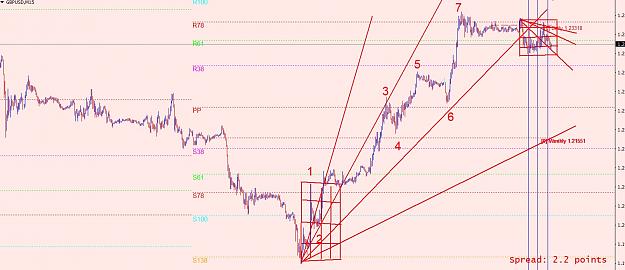
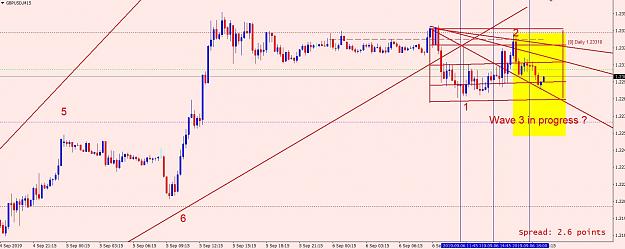
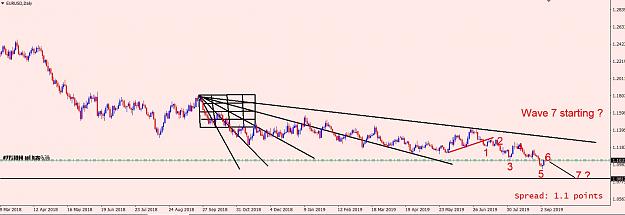
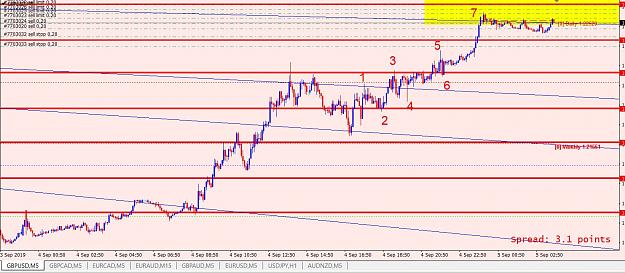
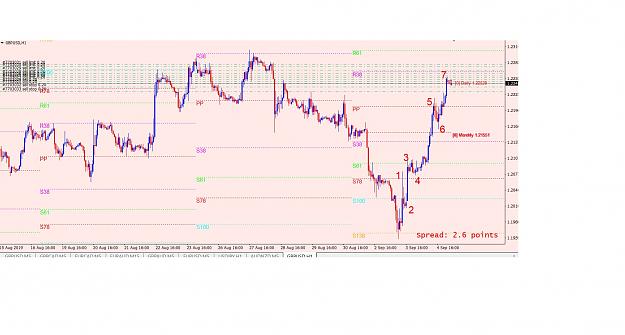
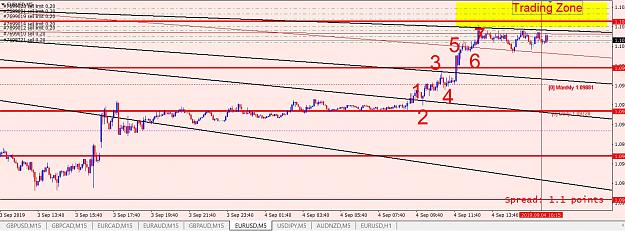
- priceact.fx replied Sep 4, 2019
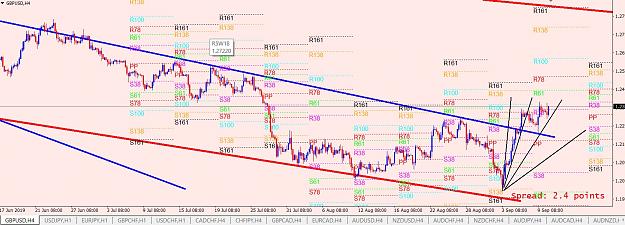
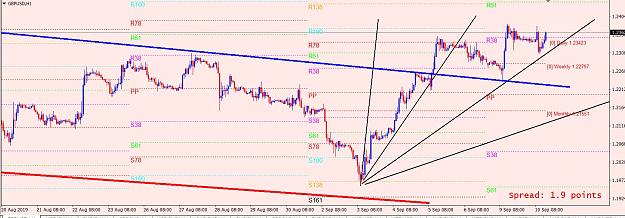
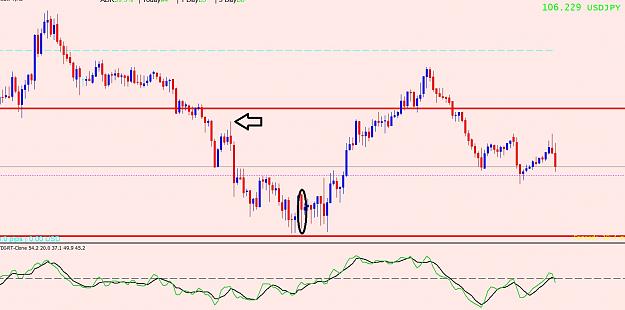
GBPUSD has completed 7 moves on H1 and M5. Price is near a Confluence zone of R38, Gann's fan line, Gann's Square of 9 level. Potential reversal? image image
Time and Price Forecasting
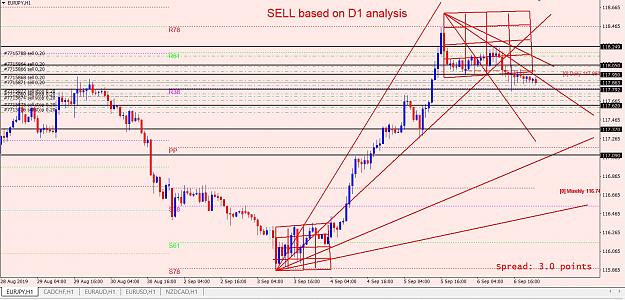
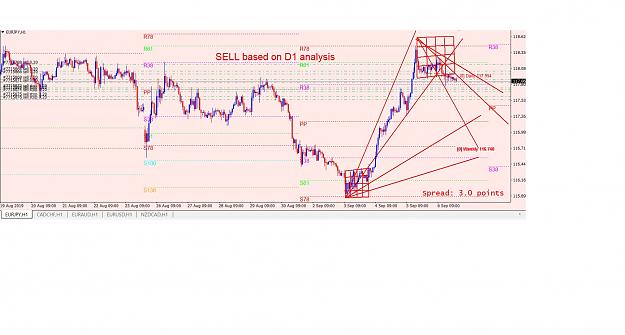
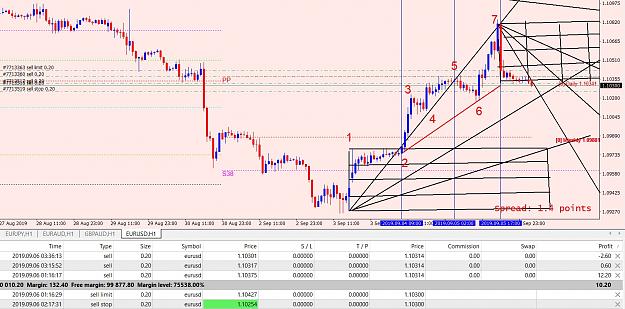
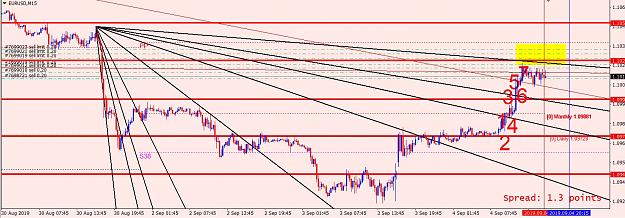
- priceact.fx replied Sep 4, 2019
Thanks, Pete. Example of using 7 moves ( i just entered a SELL trade on EURUSD). I also added Gann's fan in MT4 on M15 timeframe. Following are the confluence factors i am seeing: 1. The price is closer to Weekly pivot (I am expecting it to get ...
Time and Price Forecasting
- priceact.fx replied Sep 3, 2019
Hi Ponson, Although my earlier screenshots had TDI, i do not use it. So i cleaned up the indicators before uploading the zip file in my earlier post. I cannot comment on if the counts are related to TDI as i dont use that indicator as part of my ...
Time and Price Forecasting
- priceact.fx replied Sep 2, 2019
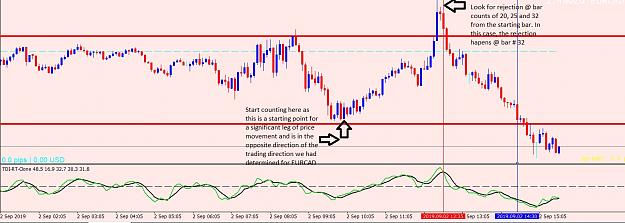
All 6 trades taken today on M5 time frame (using the steps i had mentioned in post # 33 and the pairs for this week) are positive. Adding Gann's Square of 9 and SQRT methods is definitely improving the results. image How i calculate the counts ...
Time and Price Forecasting
- priceact.fx replied Sep 2, 2019
Hi Pervaz, The price value i input would be one of highest or lowest on a given time frame (Example: 5 min ) 1.1091; i input this value as 11091 and following is what i get. Hope this helps. Regarding the counting of bars, i will add additional ...
Time and Price Forecasting
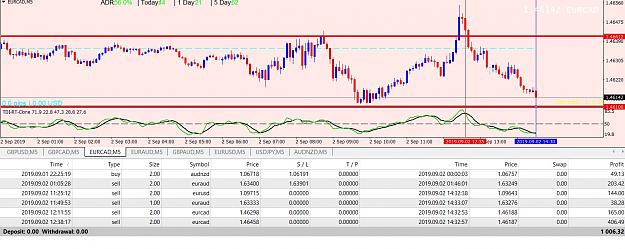
- priceact.fx replied Sep 1, 2019
Entered a sell in EURAUD as the criteria matched for entry. 16 pips profit. Earlier, missed SELL trades on GBPUSD and GBPCAD... both would have been winners... Oh well...Need better focus to trade on M5 image
Time and Price Forecasting
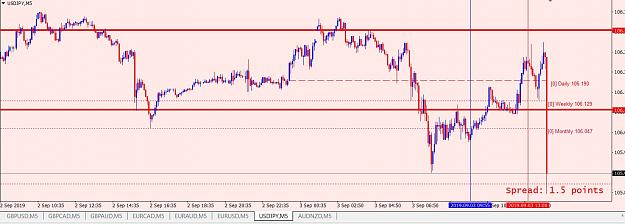
- priceact.fx replied Sep 1, 2019
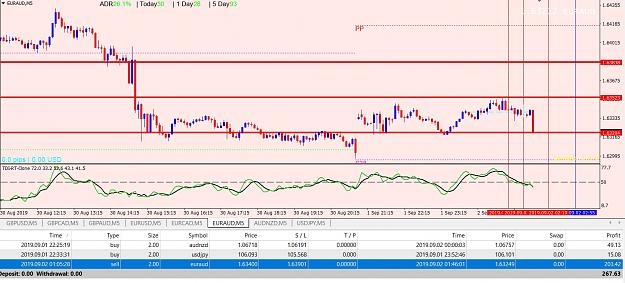
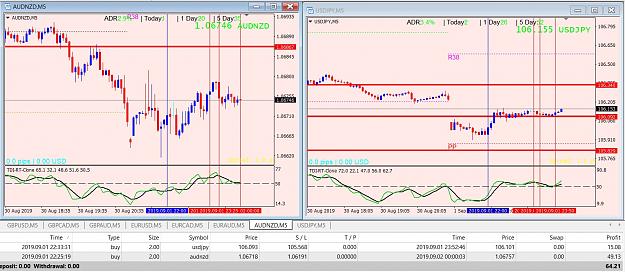
Entered 2 trades in Asian session - AUDNZD BUY, USDJPY BUY as the criteria matched for entries (Please see post #33 above; The blue vertical lines are in the area of entry and the 3 red vertical lines represent the potential reversal bars - and ...
Time and Price Forecasting
- priceact.fx replied Aug 31, 2019
Hi Sergio, Thank you for going through my post. I do not use any special software for the Square root calculations. I calculate using calculator or Excel. I am not sure if this is the best way to use the SQRT method but this seems to work in back ...
Time and Price Forecasting
- priceact.fx replied Aug 30, 2019
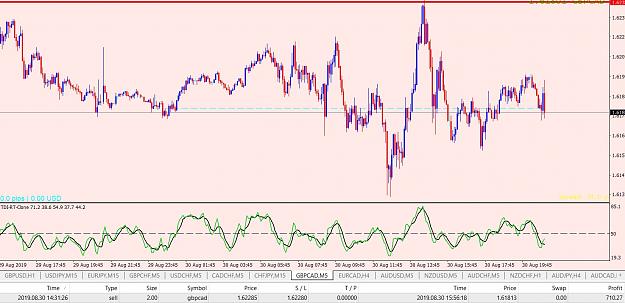
Thanks for the wealth of information, Pete. Using fundamental / sentiment analysis, GBPCAD was bearish (CAD's GDP printed green and as we are aware, Brexit is wearing down on GBP) and then using the SQRT(2), SQRT(3) and SQRT(5) method helped ...
Time and Price Forecasting
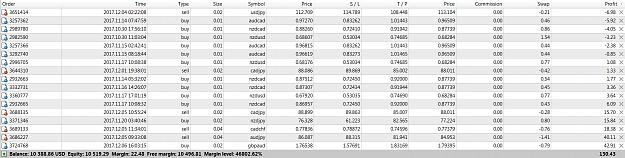
- priceact.fx replied Dec 7, 2017
Hello fellow traders, Can you provide your valuable comments on the detailed statement - trades are taken using Price Action strategy on higher time frames. Also attached is a screenshot of the latest trades taken in the account (not closedyet). ...
Simple, Powerful and Effective Price Action Trading Strategies
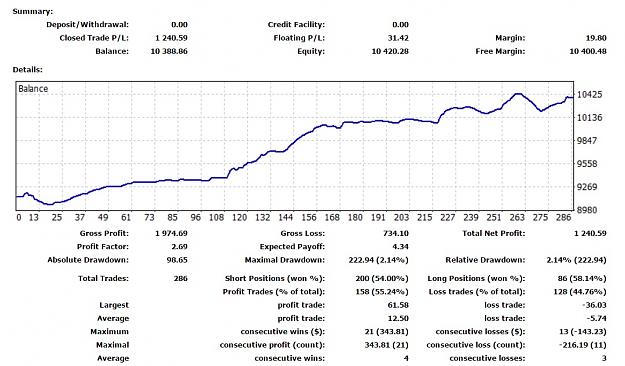
- priceact.fx replied Dec 5, 2017
hello fellow traders, i have been trying out a price action trading strategy for about an year. attached is the summary. can you let me know what you think? thanks in advance. image
Trading Made Simple
- Posts by Member Search: 'priceact.fx'