- Search Forex Factory
- 24 Results
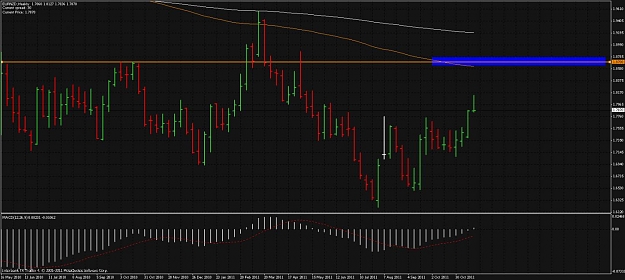
- phpscott replied Nov 26, 2011
To add to what Mike said... Only mark obvious PPZs. The PPZ you have on your chart does not stand out on the weekly timeframe (it probably stands out on the daily timeframe). 1.87 is the closest weekly PPZ I see on the upside. Interesting enough, ...
james16 Chart Thread
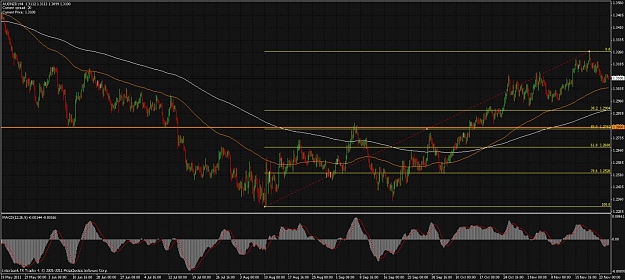
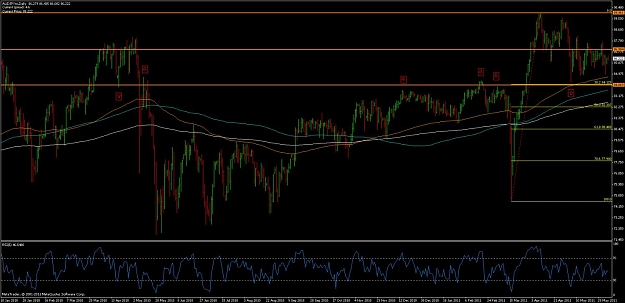
- phpscott replied Nov 24, 2011
Short answer... an easy pass. A decent PPZ but there is nothing else working in its favor. In other words, no confluence. In fact, the confluence of the 38,2 fib and 150 EMA would work against a long position. Take a look at the attached AUD/NZD 4 ...
james16 Chart Thread
- phpscott replied Jul 2, 2011
What the heck... here's a chart. See the awesome resistance at 0.9100? That is what we like to see. If a PA setup forms at 0.9100 and it does not work out, it is NOT my fault.
james16 Chart Thread Scott
Scott
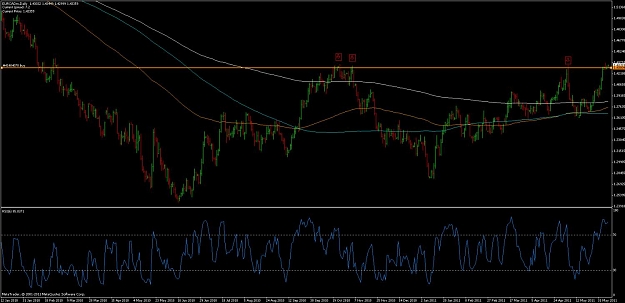
- phpscott replied Jun 7, 2011
EUR/CAD Chart — Entered long at 1.4306 and placed SL at 1.4270. After a surgery operation, I looked at this chart pretty close. There was solid resistance at 1.4300. Price closed above that area last Friday -- not by much but it did. Price ...
james16 Chart Thread
- phpscott replied Jun 5, 2011
The location is only so-so in my opinion. Look to trade PA setups at areas of strong confluence only. If the pinbar occurred at 84.00, I would be all over it. See the attached chart for reference. Scott PS. Zoom out to see the bigger picture. Your ...
james16 Chart Thread
- phpscott replied Feb 5, 2011
I would not trade this one. However, if I did, 1.3450 would be the first support area -- all the bar highs. I have 1.4 noted on my chart. See all the confluence at 1.4? Those are the areas to watch for PA setups. If you take more than a few weekly ...
james16 Chart Thread
- phpscott replied Jan 3, 2011
Based on current price action, the purple line is the first area price could reverse and re-test the top of the range. See the price flip at 1.3250? I cannot show you what Mike is referring to in his second paragraph visually, so I will let him ...
james16 Chart Thread
- phpscott replied Dec 13, 2010
I placed a small buy stop order a bit above 1.60 myself. The PB looks to be at an odd spot but occurred at extremely solid support. It does have 1.60 in its way, so I am my order is not based on the break of the bar. I am also not looking for a very ...
james16 Chart Thread
- phpscott replied Nov 30, 2010
It is a nice looking BEOB, however, the location is not good. I attached a chart of the PPZs I see and a fib. I never place fibs on tiny swings like you did because the fib. levels are very close to each other. You should look to take trades at ...
james16 Chart Thread
- phpscott replied Oct 2, 2010
Another view of AUD/NZD — Looks like a choppy sideways market at its finest. Looks like it will likely go higher but may drop to 1.28 first. Only time will tell.
james16 Chart Thread Scott
Scott
- phpscott replied Sep 19, 2010
I would not trade either. The FTA is just below the low of the bar on the GBP/CHF. And the location on USD/CAD is not good. Below is the USD/CAD chart for a visual. The blue shaded area is where to look for bullish PA. Notice the confluence? Scott
james16 Chart Thread
- phpscott replied Jul 4, 2010
Bryan, I passed on this one but you are far from a dope. The PB was at good support, however, it had little room to move. The first trouble area was 61.00 so price did what we expect. Below is a visual.
james16 Chart Thread
- phpscott replied May 30, 2010
I would never trade that PB. The location is OK but not great. The nose barely extends past the low of the previous bar. Also, the market has been sideways with a bearish bias since mid October of last year. If I did trade it, I would expect price ...
james16 Chart Thread
- phpscott replied Mar 27, 2010
GBP/USD Daily — The IB on GBP/USD daily caught my eye. Price is at previous low with divergence on MACD. I have not decided if I will place a pending long order or not. I marked the trouble areas. If I do place an order, my entry will NOT be ...
james16 Chart Thread
- phpscott replied Sep 6, 2009
Is it just me or does Gold look rather interesting?
james16 Chart Thread Scott
Scott
- phpscott replied Aug 13, 2009
Chart — I entered short on the break of yesterday's BEOB. I entered short because of the double top and fib retracement. Since this was a minor swing high, I planned on taking full profit on a small move only. The next bar missed my TP by 10 ...
james16 Chart Thread
- phpscott replied Aug 6, 2009
Trade I took — Here is a trade a GBP/CAD trade I was in earlier today. I closed my entire position with a 62 pip profit. I do not take partial profit on trades. If price cannot break the closest support/resistance (purple line in this case) ...
james16 Chart Thread
- phpscott replied Jul 19, 2009
Here is my interpretation of the same chart. Unsure if wave 4 is still in progress or if wave 5 has begun. Scott
Elliott Wave Trading
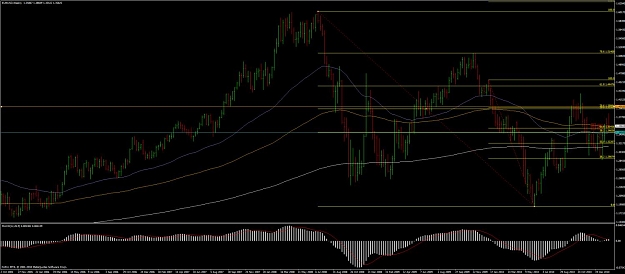
- phpscott replied Jul 18, 2009
Attached is my analysis for EUR/USD daily. I does appear that wave 2 ends above the starting point of wave 1 on bar/candle charts, however, it does not when viewing a line chart (close only). Subwave I of 3 was extended so wave 4 ended near the ...
Elliott Wave Trading