- Search Forex Factory
- 24 Results
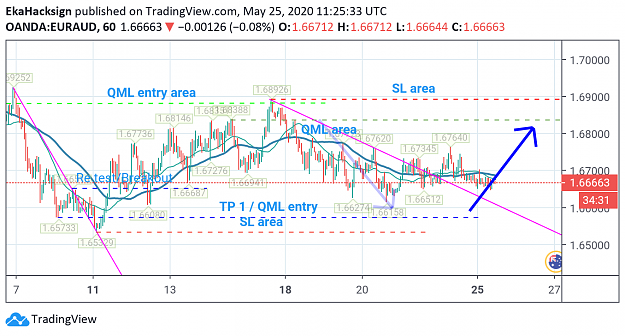
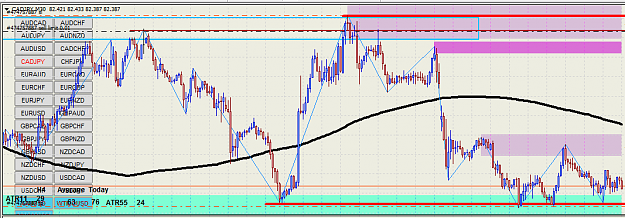
- newtraderer replied May 25, 2020
hi pip, I plan to buy at 1.65733, is it correct?
Up and under price pattern
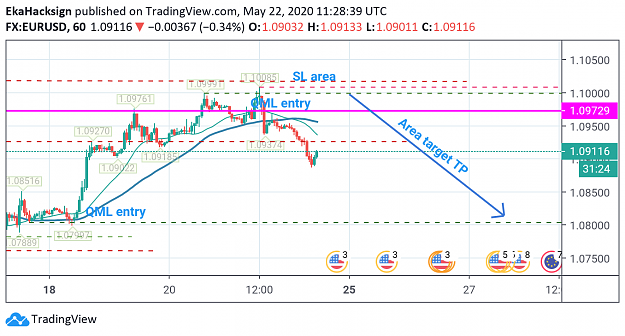
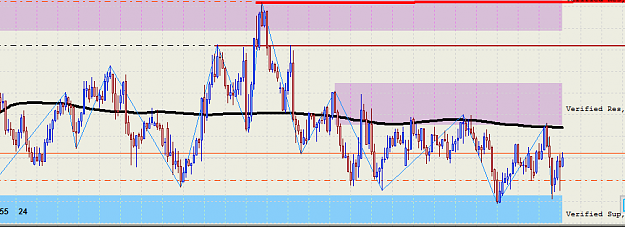
- newtraderer replied May 22, 2020
Hei Pip, can you help me... is this the QML right?
Up and under price pattern
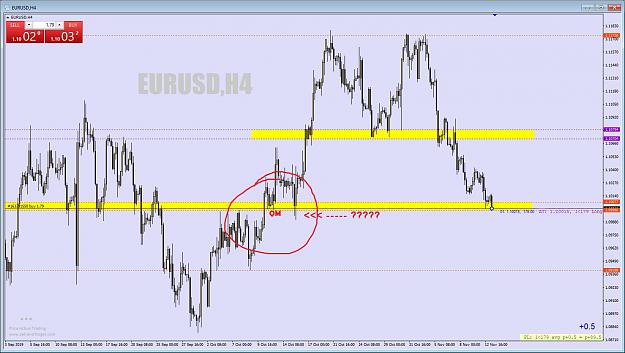
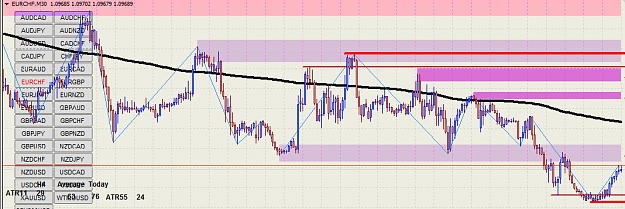
- newtraderer replied Nov 13, 2019
Hi Pat, can you explain, why this question mark we call QM Level...?
Up and under price pattern
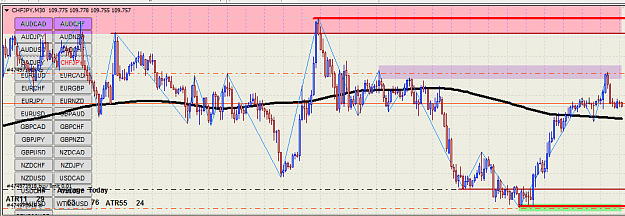
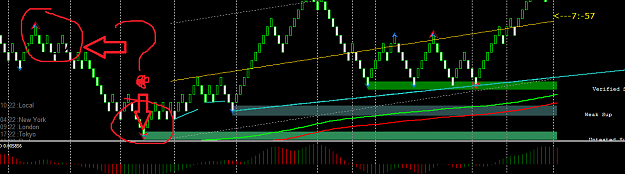
- newtraderer replied Nov 11, 2019
Is the trendline that I marked included in the QM Level ...? because some of the QM levels that I marked like in the picture, don't do candle reversals, they break through and continue the trend
Up and under price pattern

- newtraderer replied Nov 5, 2019
why is the tail of my candle on my mt4 not touching it ...? if i could find out what kind of broker are you?
Up and under price pattern
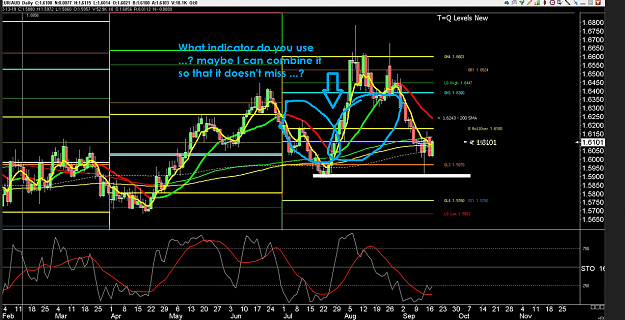
- newtraderer replied Sep 17, 2019
what indi do you use, maybe i can combine it so that it doesn't miss
General Trading Chat / Ideas
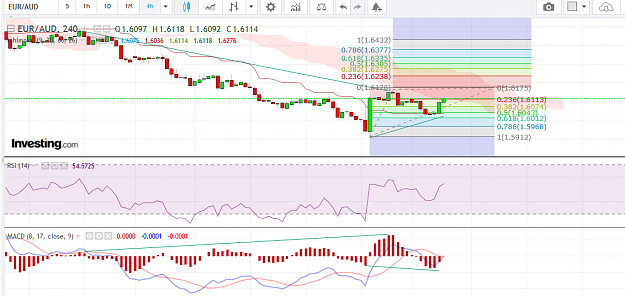
- newtraderer replied Sep 17, 2019
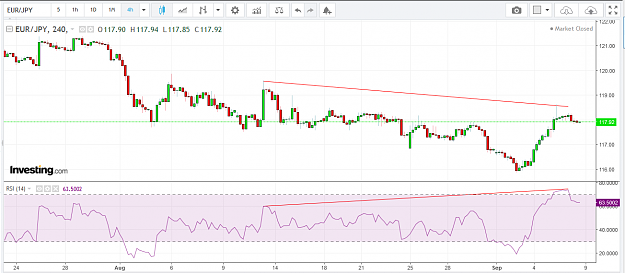
i found new hidden divergence here, and i think this currency will be break previous regular divergence, any suggestion for me...?
General Trading Chat / Ideas
- newtraderer replied Sep 13, 2019
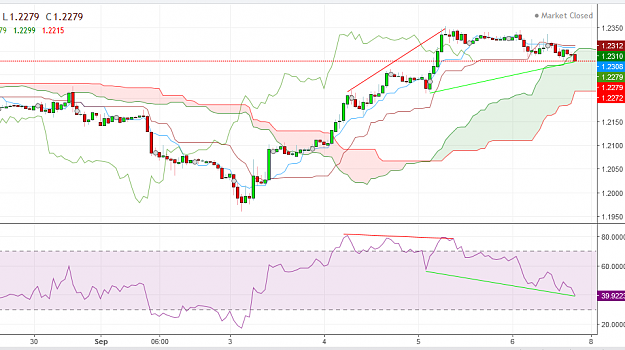
like the following picture, the green line is regular divergence, and after that I have tried to look for further regular / hidden divergence patterns, but I did not find it, and finally the trend returned to the top.
Hidden divergence
- newtraderer replied Sep 13, 2019
like the picture I showed, there is a regular divergence, but why does the price go back up ...? whereas after the regular divergence appeared I did not find any further divergence patterns as a sign that the next trend was bullies
Hidden divergence
- newtraderer replied Sep 9, 2019
anyone can help me, why do prices continue to rise ...? even though I didn't find regular / hidden divergence ...?
Hidden divergence
- newtraderer replied Sep 8, 2019
Is the divergence pattern like the following picture are correct ...?
Hidden divergence
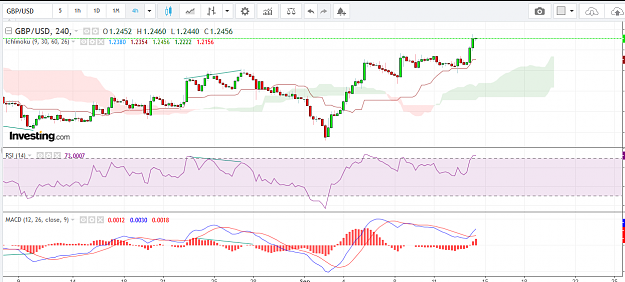
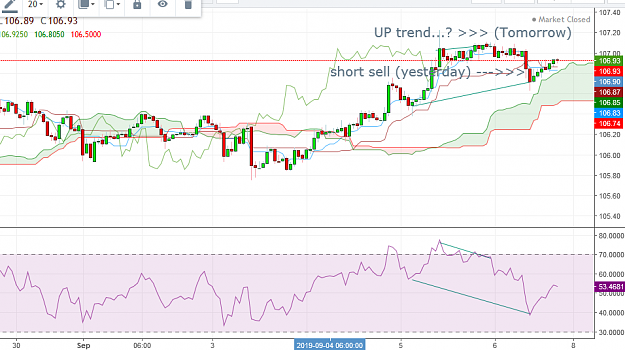
- newtraderer replied Sep 7, 2019
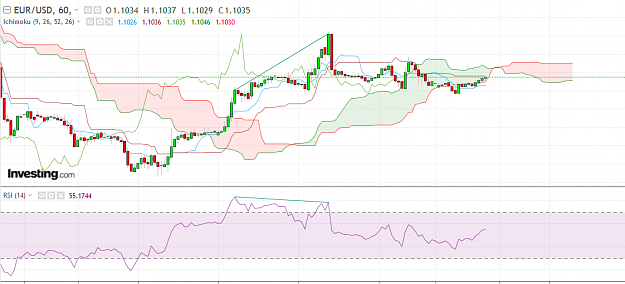
can this pattern be confirmed as a divergence pattern ...? because before I was in a short position, I decided to sell because before the divergence pattern was formed. But the pattern that I have shown hasn't crossed the Ichimoku cloud from the ...
Hidden divergence
- newtraderer replied Nov 28, 2018
Hi everyone, can anyone help me with this problem, I don't know about Indicator or EA. Can the fractal that I marked in the image appear earlier ...? because the fractal that I mark often late appears, the appearance of a red-headed fractal always ...
I will code your EAs and Indicators for no charge
- newtraderer replied Nov 20, 2018
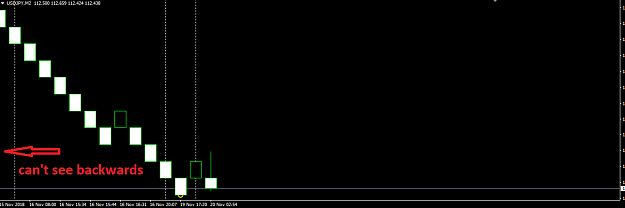
Hi Slash, Can you help me, I tried installing the Renko chart and it worked, but the period of the candle displayed on the timeframe was very limited, I could not see the candle from the previous weeks ... can you help me to finish this?
More simple is impossible

- newtraderer replied Nov 20, 2018
Hi Intrepidpips, Can you help me, I tried installing the Renko chart and it worked, but the period of the candle displayed on the timeframe was very limited, I could not see the candle from the previous weeks ... can you help me to finish this?
Renko Matrix
- newtraderer replied Nov 20, 2018
can anyone help me?, I plan to combine this concept with my chart renko, and want to know the results, but when I enter the renko chart, the period display of the candle that appears on my timeframe is very limited, I can't see the previous week's ...
Southern Cross Trader

- newtraderer replied Nov 20, 2018
hi Libo, Can you help me, I tried installing the Renko chart and it worked, but the period of the candle displayed on the timeframe was very limited, I could not see the candle from the previous weeks ... can you help me to finish this?
Dax - Daily analysis and Discussion

- newtraderer replied Nov 20, 2018
Hi Leon, Can you help me, I tried installing the Renko chart and it worked, but the period of the candle displayed on the timeframe was very limited, I could not see the candle from the previous weeks ... can you help me to finish this?
I will code your EAs and Indicators for no charge

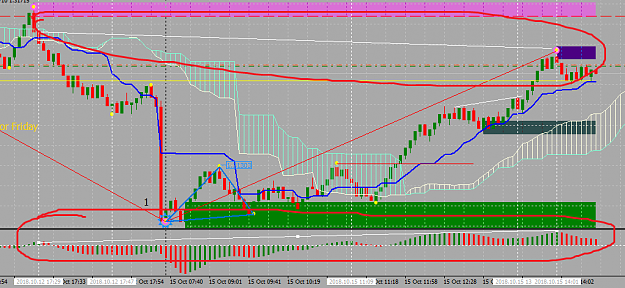
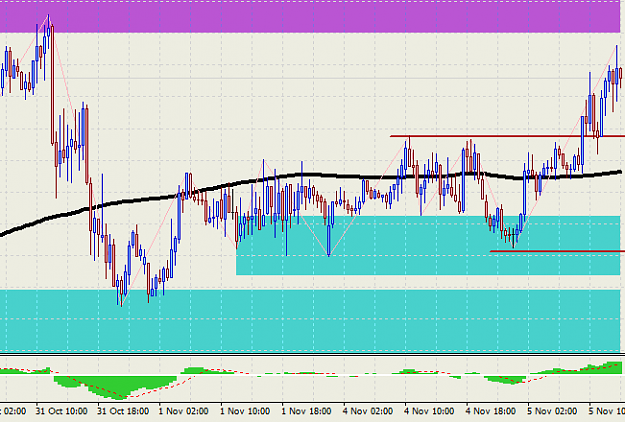
- newtraderer replied Oct 16, 2018
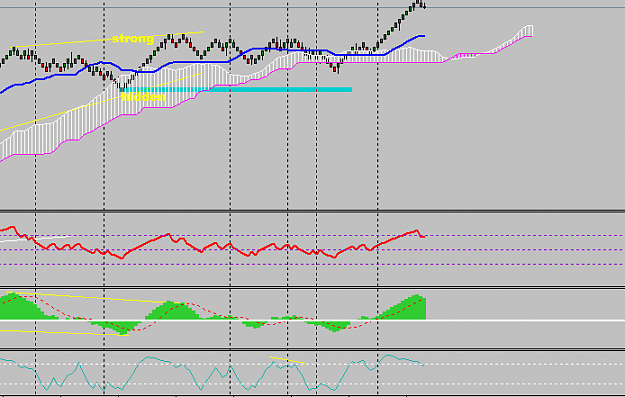
I want to ask, the sign that I am circling, is that before we decide to sell/buy after crossing the purple line, we always have to make sure that the oscillator that I give circle must always be in only 1 wave?
Trading with range bars ichimoku cloud & awesome oscillator

- newtraderer replied Oct 15, 2018
Is this really going to the upward trend? because I saw on my chart, found hidden divergence
Cable Update (GBPUSD)