- Search Forex Factory
- 20 Results (1 Thread , 19 Replies )
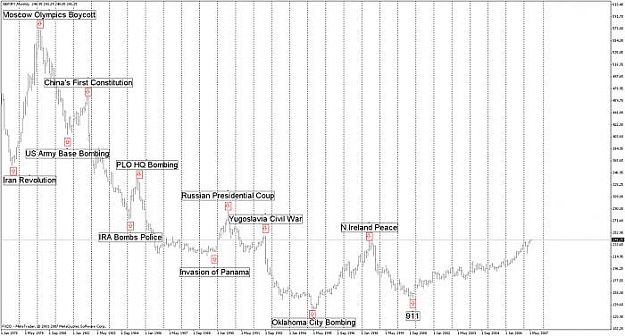
- mono replied Nov 20, 2007
Last 24 hrs there 14 entries (not including pullbacks), even if your target was a low 20 pips that equates to 280 pips in your pocket.
- mono replied Nov 20, 2007
Here is a trade I would of taken if I was @ the computer. ADX_CCI was at flatline and price hit outter band, so I would have shorted. Result would have been about 60 pip profit
- mono replied Nov 20, 2007
fxking, Look at the charts I have posted, for sample entries and exit. There are many different methods/combinations of entries within the chart. I keep my stoploss tight usually 30 pips and my targets could be anything from 30 - 100 pips. Look at ...
- mono replied Nov 20, 2007
Here a example of different type of trade QQE crosses its signal line then crosses the 50. ADX_CCI crosses zero line. chimp crosses zero line price crosses ema We Enter long and we are in a trend and take profit @ ema outter band. We then look for ...
- mono replied Nov 20, 2007
Guys, you need to make you own rules for entry and exit. All I ask is to post your observations But here is an example Here is a chart with 2 entries, the first would have resulted in 50-60 pips, second about 30 pips
- mono replied Nov 20, 2007
Another Entry
- mono replied Nov 20, 2007
Trend entry
- mono replied Nov 20, 2007
More Entries
- mono replied Nov 20, 2007
Chart showing posiible entry
- mono replied Sep 4, 2007
Multi-Timeframe Indicator — Ok Guys Time for me to add to this thread. I have created (or should I say modified) the original signal_bar indicator to reflect Auslanco's method across all timeframes at the same time on one screen. Labels GSMA = ...
- Events That Changed Market Direrection
I was bored so I started to track marjor events the changed market direction. I used GBP/JPY mainly ...
- mono replied Mar 7, 2007
Love It when things piece together — JokersWild I see you like the gbpjpy too.....For this system this pair is awsome. here's my screen.
- mono replied Feb 2, 2007
Delete if required — And the 15 Min
- mono replied Feb 2, 2007
Delete if required — Hourly charts
- mono replied Feb 2, 2007
Delete if required — Daily charts
- mono replied Jan 23, 2007
And the Daily
- mono replied Jan 23, 2007
Here's the Weekly outlook.
- mono replied Jan 23, 2007
My outlook for feb is a down month. Red Arrows telling me after a month of of new highs, down month will follow. Green the opposite.
- mono replied Sep 14, 2006
Here my chart
- mono replied Aug 17, 2006
Ok, Currently firebird uses a tunnel which is created by MA10 +10% and MA10 - 10%. (or whatever you have set it at) So you have upper band and a lower band. When the price reaches the lower band, Firebird buys, and when it reaches the upper it ...
- Posts by Member Search: 'mono'