- Search Forex Factory
- 13 Results
-
 mikeylp replied Jan 7, 2013
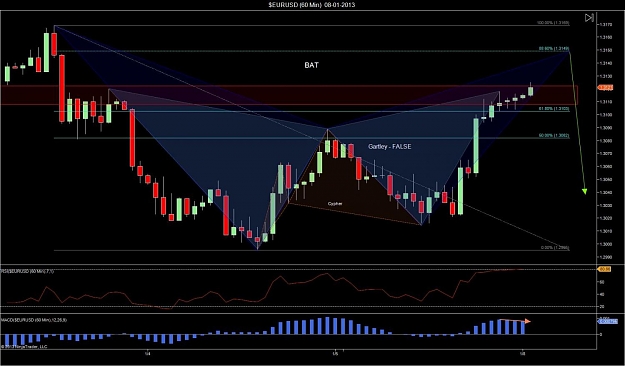
Hey It looks like the bulls are strong, or the bears are week during these hours... It looks like current res. levels wont hold, so at least Gartley Pattern is a false signal now, I haven't opened shorts yet, because there is a minor divergence ...
Euro/Dollar
- mikeylp replied Jan 7, 2013
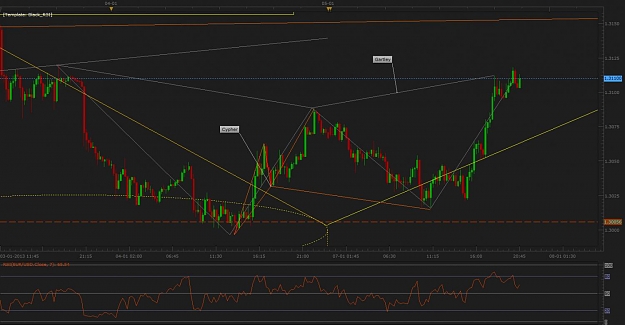
Hey, Nice stuff you bring here... Below is another potential reversal on 15m chart, a Gartley Pattern: image
Euro/Dollar
- mikeylp replied Jan 3, 2013
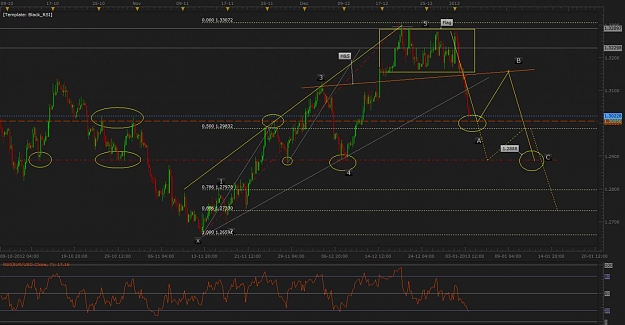
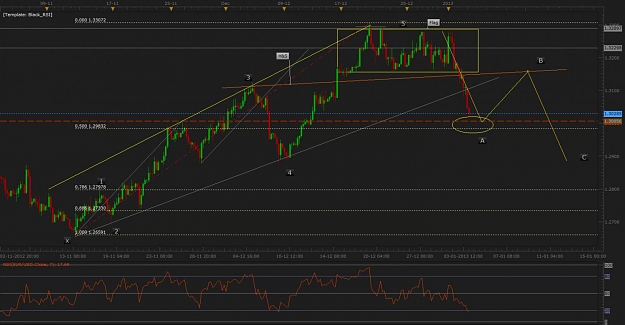
Hey Mates. Though I am not in the trade for EU pair currently, waiting for a retrace to join, in case it goes by the plan, or any other resistance level that can be supported with additional confirmation. The following chart shows the plan if it ...
Euro/Dollar
- mikeylp replied Jan 3, 2013
No argue about the oversold/bought stuff, though I do expect following moves, taking into account DRS, possible H&S, waves, possible BAT, a Cypher maybe, my next move would be after a retracement of course since the the structure support levels were ...
EURUSD
- mikeylp replied Oct 8, 2012
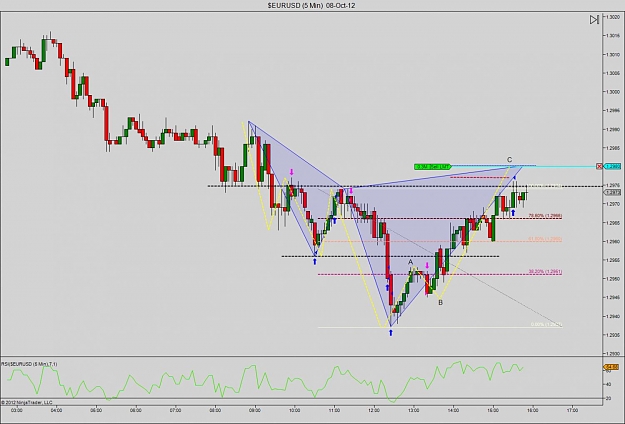
EURUSD - Cypher and Elliot 5m — Hey An Idea for a Cypher about to form along with a corrective Elliot wave (ABC), nice one; Of course at least fib-38.2 retrace for current move for 1st target, image Green Pips
Euro/Dollar
- mikeylp replied Sep 14, 2012
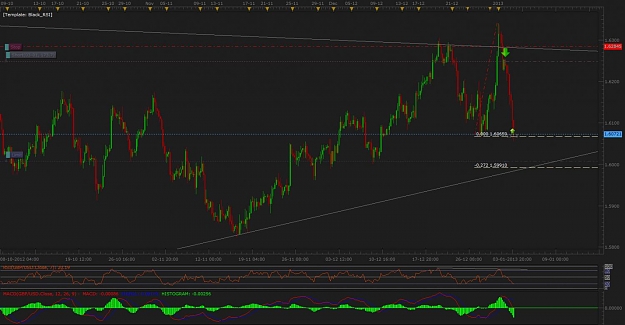
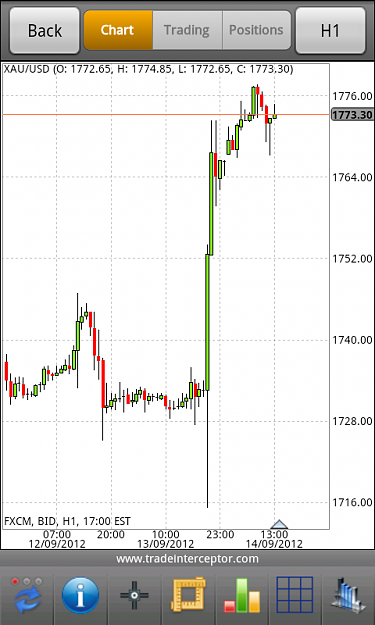
image The Gold has had a hammer on 1h chart, it supported nice at the 1767 price level, we should see a continuation now, in case previous highs are btoken with higher closes.
Euro/Dollar
- mikeylp replied May 23, 2012
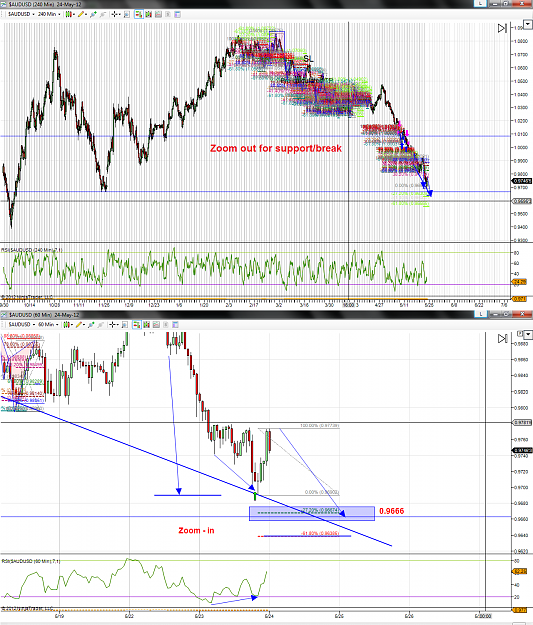
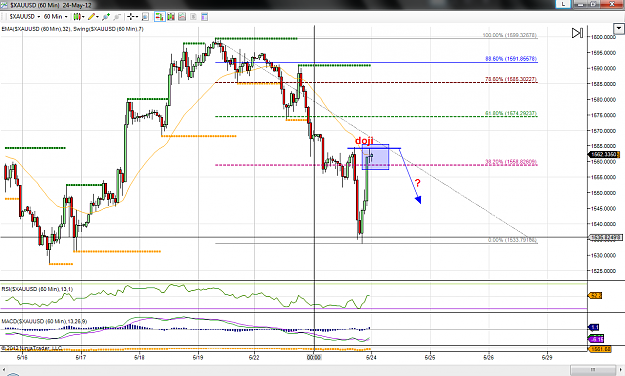
Another idea, though for Aussie Sorry for posting other charts in this thread, but personally I cannot follow many threads and trading many markets; though EURUSD is the main one. Profitable pips to you all (or a nice bathe)
EURUSD
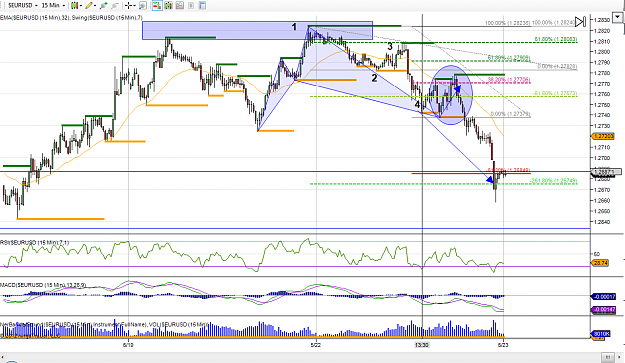
- mikeylp replied May 22, 2012
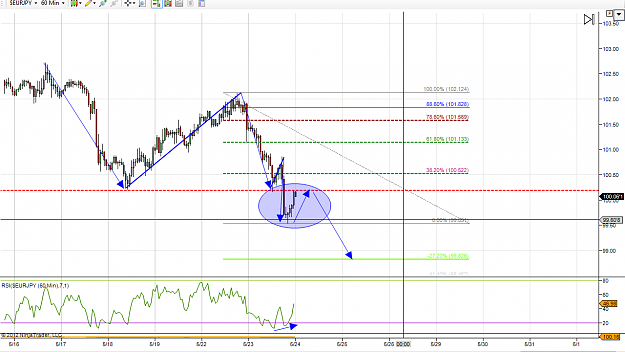
Oh man... I saw several post for the last day and there were many bad trades, is it a "trend" that you saw for bullish? It was a clear reversal double top and then a nice 1234 to fib 261.8. Wish you best trades:
EURUSD
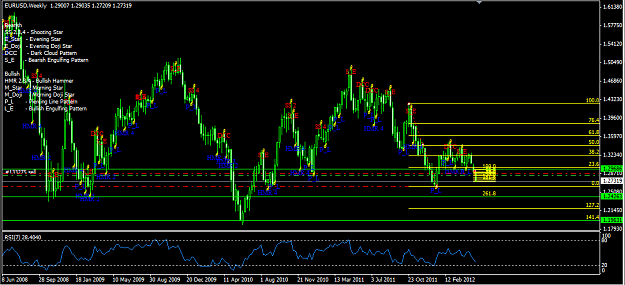
- mikeylp replied May 15, 2012
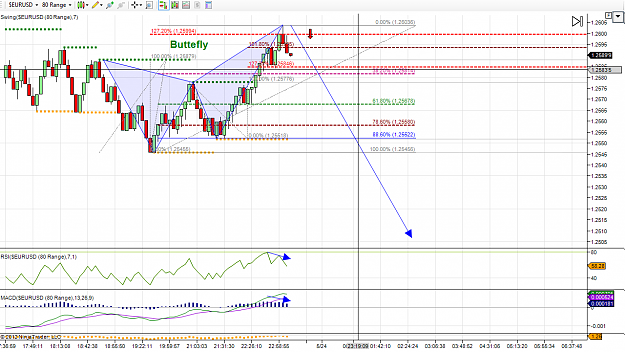
Hey mate, I really don't get what you meant by "long" Either way, if it breaks the 1.2623/1.2586 (support) then we shall see it to the next point which is ~1.2457. It is that simple. Probably retracement to some valuable fib level and then back on ...
EURUSD
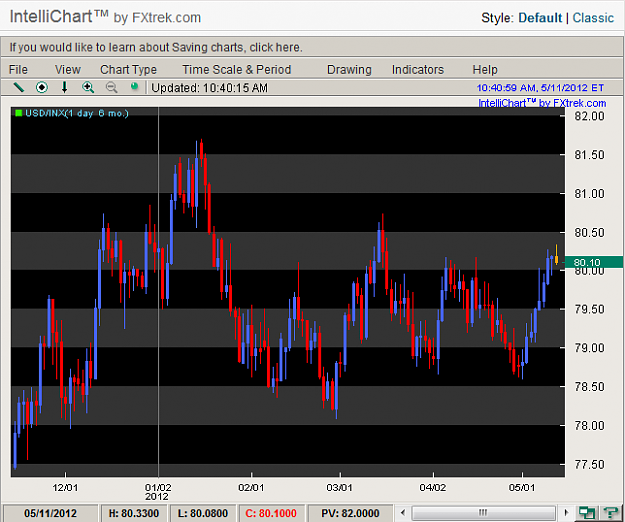
- mikeylp replied May 11, 2012
Don't know mate, but 20pips even more seems to be like for stop losses for day trading, I have up to 40pips right now. The take profits should be analyzed and much more profitable.
EURUSD
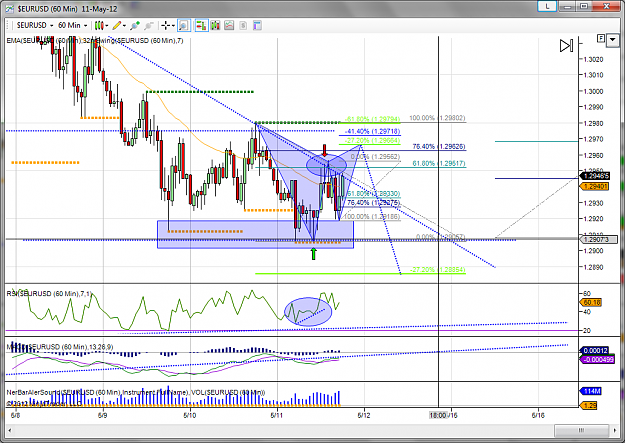
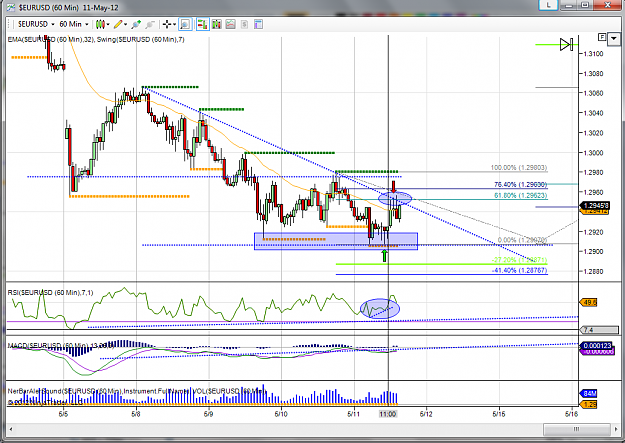
- mikeylp replied May 11, 2012
It looks like we have a shooting star at Fib 61.8 level, which says "bearish" but we also have double down levels for trend to change, we should probably see what happens in 30 minutes when the USD news are released. Like previous post mentions ...
EURUSD
- Posts by Member Search: 'mikeylp'