- Search Forex Factory
- 16 Results
-
 marketsnipers replied Jun 29, 2007
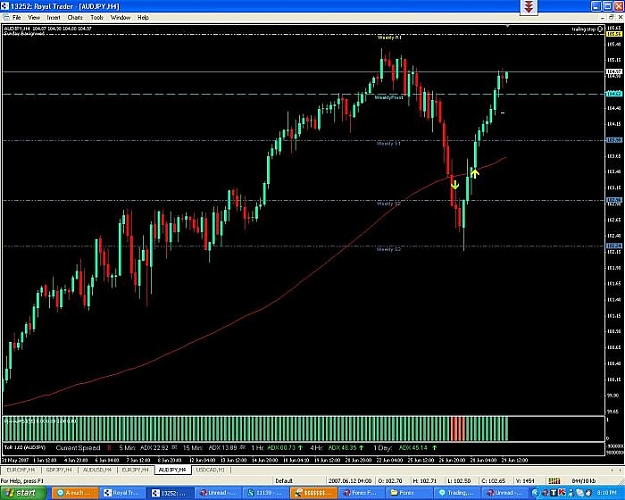
AUDJPY — Ok, here is one of the trades I took this week. Up 145 pips. I closed 1st pair for 33 pips, second for 93 and third one is still on. You can see a sell before that, but I did not take it since trend is strongly Bullish. Thanks
Simple 4 Hour System
- marketsnipers replied Jun 17, 2007
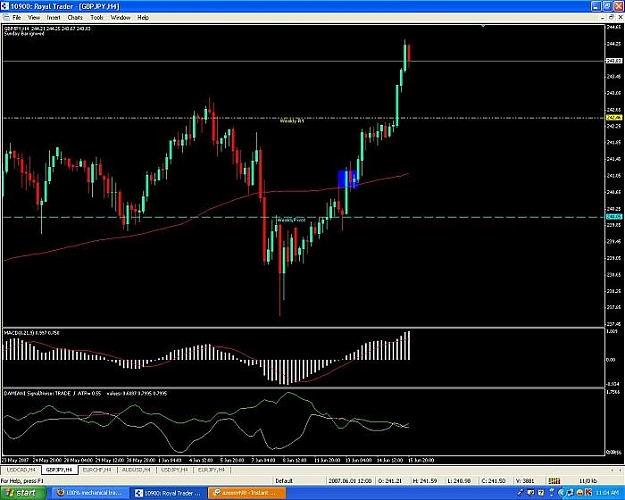
GBPJPY trade — Here is the screenshot of the GBPJPY trade I took. The candle colored blue is where I took my trade. The actual entry was 241.16, but since the bar was long, I waited for a retracement and got in at 240.94. The trade was good ...
Simple 4 Hour System
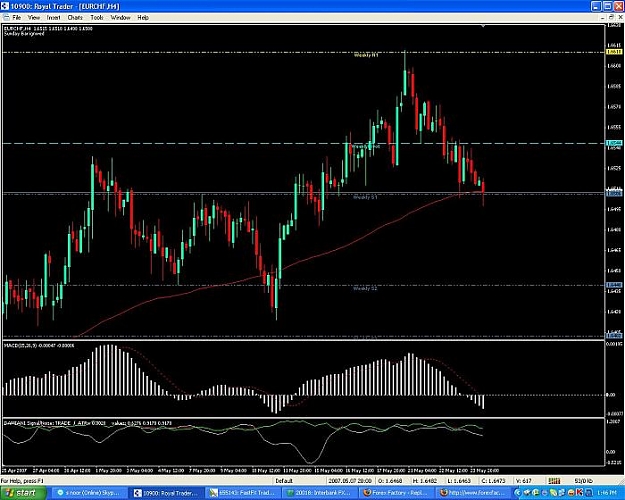
- marketsnipers replied Jun 7, 2007
Something about discretion — Take a look at this chart. I entered at a short at 1.6493, at a break of the weekly Pivot and 100 SMA. The MACD had not crossed the 0 line, yet I took it. This was my discretion. It was worth it. This is something ...
Simple 4 Hour System
- marketsnipers replied May 28, 2007
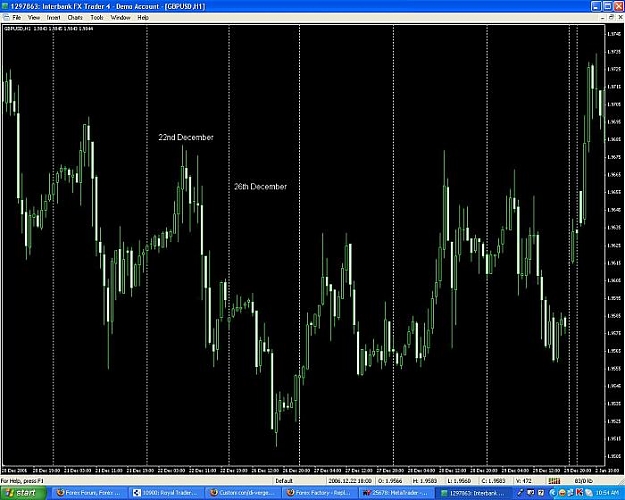
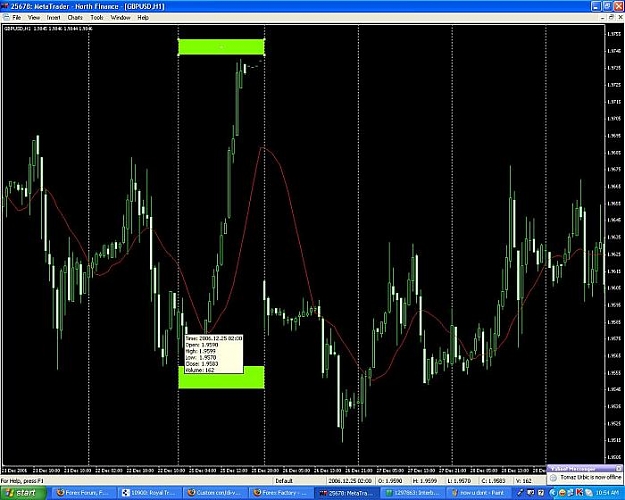
My intention here is not to prove you guys wrong. This took me 15 minutes to setup, but I hope it will be well worth it. Look at the first chart of IBFX under the name, Now you dont.jpg. You will see 22nd December and next 26th December Tuesday. ...
How Do You Trade On a US Holiday?
- marketsnipers replied May 26, 2007
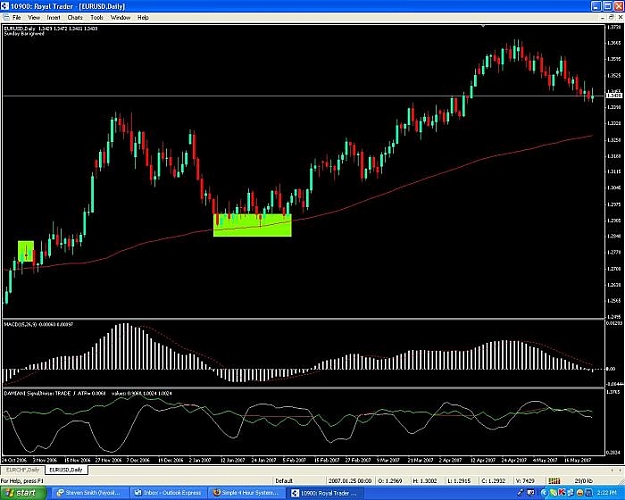
Here is a random daily chart for you from eurusd. You can see both the entry as well as the re-entry (The big rectangle box with multiple re-entries). A 900 pips move up.
Simple 4 Hour System
- marketsnipers replied May 25, 2007
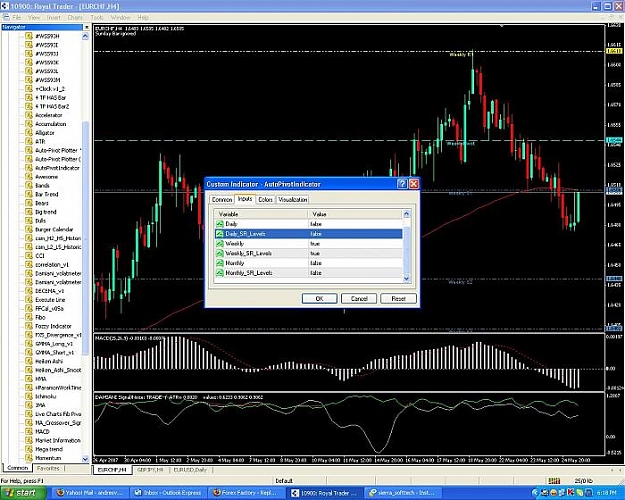
My friend, With a little effort you can save a lot of your time and others. Here is the best I can do for you. Take a look at the image. Please set your indicator to true for weekly and false for others under the INPUT tab. It will show up.
Simple 4 Hour System
- marketsnipers replied May 25, 2007
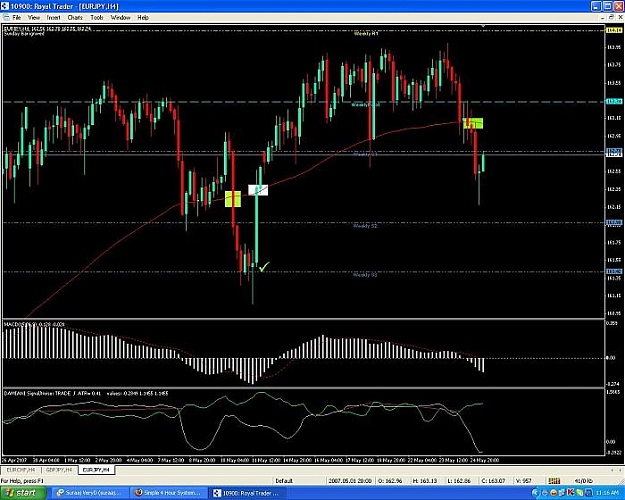
Here is a eurjpy pair. For example purpose only. There was a sell trade triggered that was good for 85 pips which means the first 2 positions were hit and the third position closed at breakeven. Look at where the sell reversed. I have placed an ...
Simple 4 Hour System
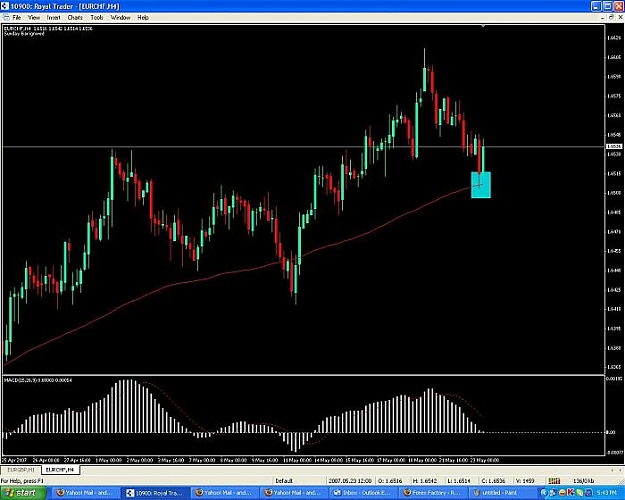
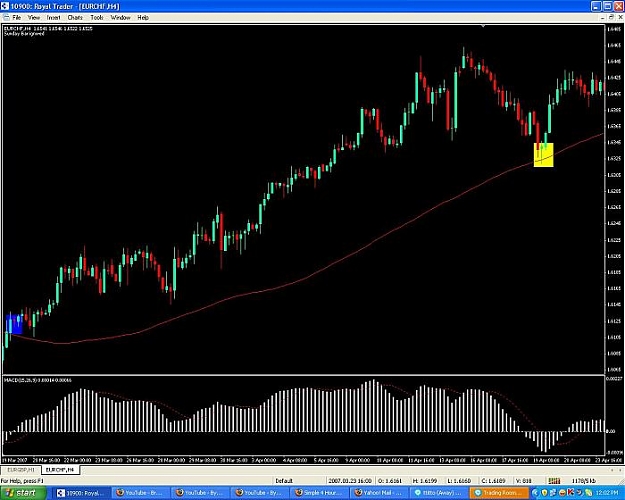
- marketsnipers replied May 24, 2007
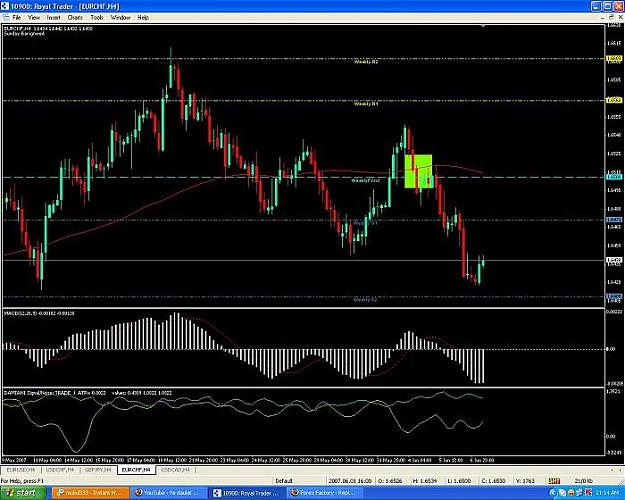
This is an update of the chart I posted a few hours back. You will see the eurchf bounced off the weekly support line and the 100 SMA line. The bar closed slightly below the 100 SMA, but since it did not break the weekly support, I did not take the ...
Simple 4 Hour System
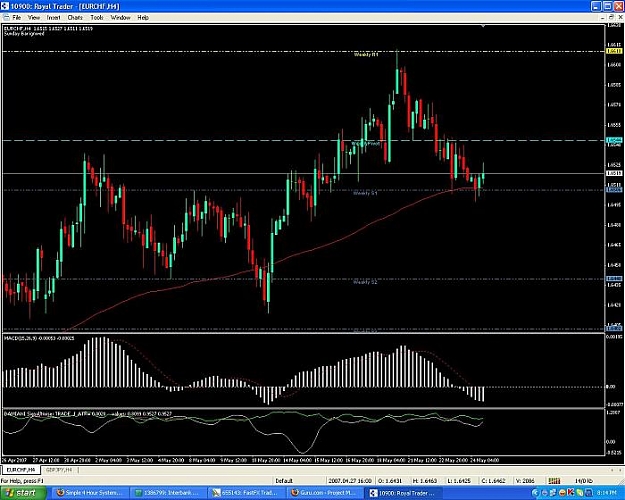
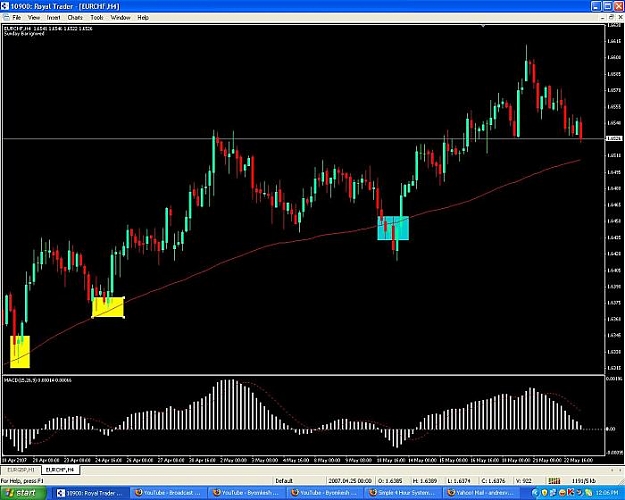
- marketsnipers replied May 24, 2007
Look at eurchf. Watch how it is hesitating at the 100 SMA line. Incidentally, it happens to be the weekly S1 too.
Simple 4 Hour System
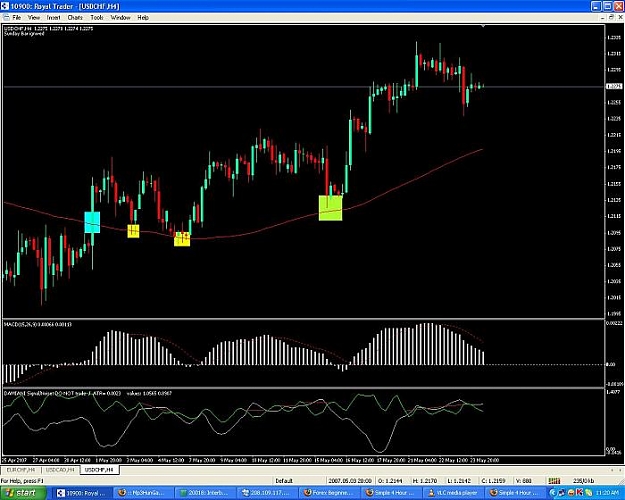
- marketsnipers replied May 24, 2007
This is a USDCHF chart. Again, I do not endorse it, as I do not trade it. Please do your own research. 1. The blue box is the main entry, but if I had taken this trade, I wouldn't enter it because the bar was over 100 pips. I would take the trade at ...
Simple 4 Hour System
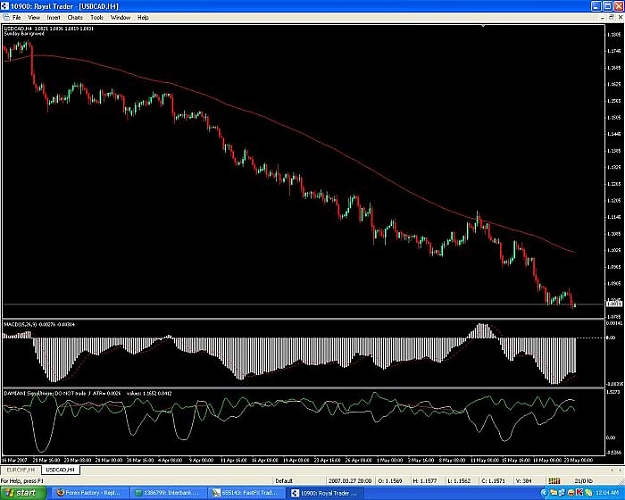
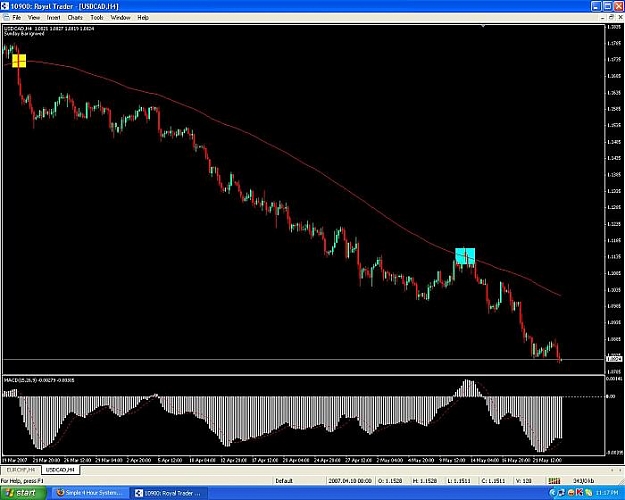
- marketsnipers replied May 23, 2007
I do not trade USDCAD. I pulled it up, just to show the main setup. Anyways, here is the chart again with the indicator. You will see, the green is above the white.
Simple 4 Hour System
- marketsnipers replied May 23, 2007
This is what I call a "Classic". A move of 850 pips. How much you want, you decide (The difficult part and one of the reason why many fail). The Yellow is the main entry and the blue is the re-entry.
Simple 4 Hour System
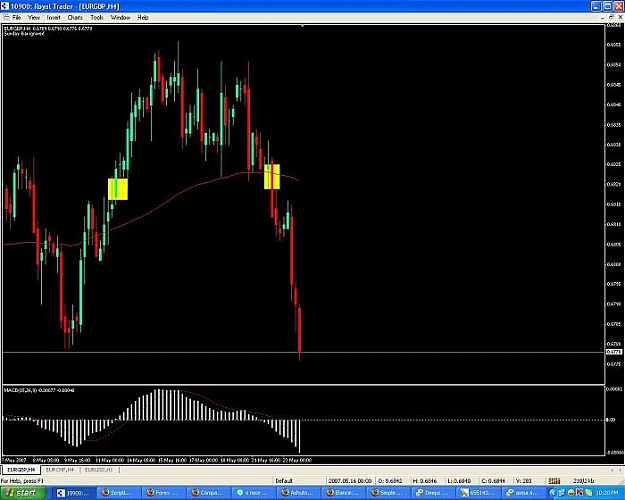
- marketsnipers replied May 23, 2007
The chart is for eur/gbp. This pair, as far my knowledge goes moves slower than a snail. Look at the places I have marked. Both trades were good for 30 pips. I say 30 pips, because thats how much it normally moves in a day. It isn't practical to ...
Simple 4 Hour System
- marketsnipers replied May 23, 2007
I have mentioned the SL part in post #7. No, I do not use MACD for re-entry. I enter when it touches the 100 SMA. Here is an example. I had a buy stop at 1.6506+4 spread, right at the 100 SMA. Trade was triggered and price went 2 pips below to ...
Simple 4 Hour System
- marketsnipers replied May 23, 2007
Chart continuation — This is the continuation of the first re-entry. Notice a second re-entry. There is a third box I have drawn. It is a false signal. Note: I take only one position while trading re-entries.
Simple 4 Hour System
- marketsnipers replied May 23, 2007
Charts — The blue box is the main entry and the yellow, you can see, is the re-entry.
Simple 4 Hour System
- Posts by Member Search: 'marketsnipers'