- Search Forex Factory
- 16 Results
-
 lumiche replied Jan 31, 2014
Hi Tnavi, What you think ? I post ago some examples of this type of trade.
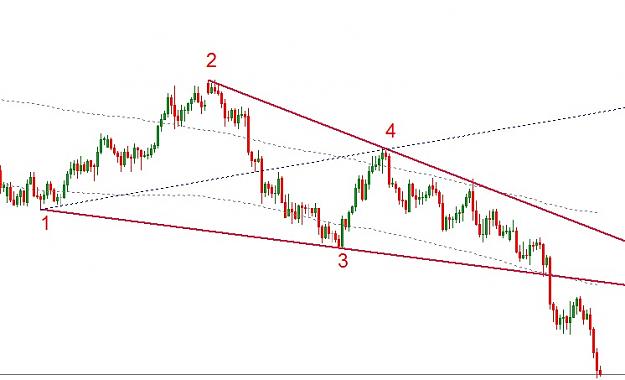
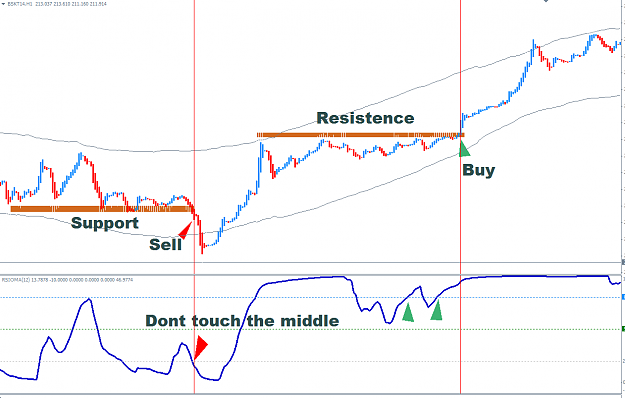
tnavi´s channel of fortune
- lumiche replied Jan 29, 2014
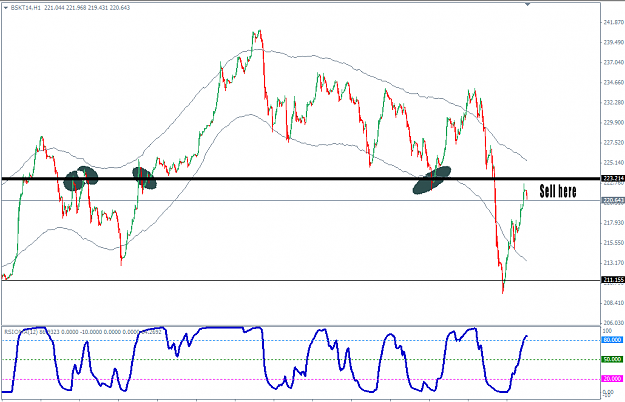
Looking some cases, I found some patterns that eventually repeat. I noticed that when RSIOMA gave a buy signal / sell and follows in the other direction but not enough to touch the middle and returns to its previous trend, the chart we can look back ...
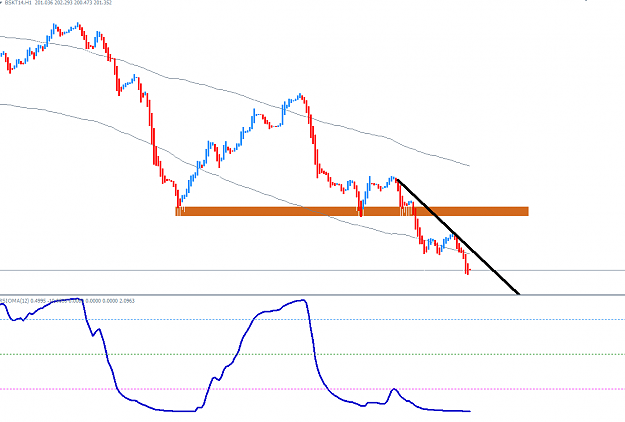
tnavi´s channel of fortune
- lumiche replied Jan 28, 2014
im out with 460 ,sell near of resistence. Nothing bad to first trade.
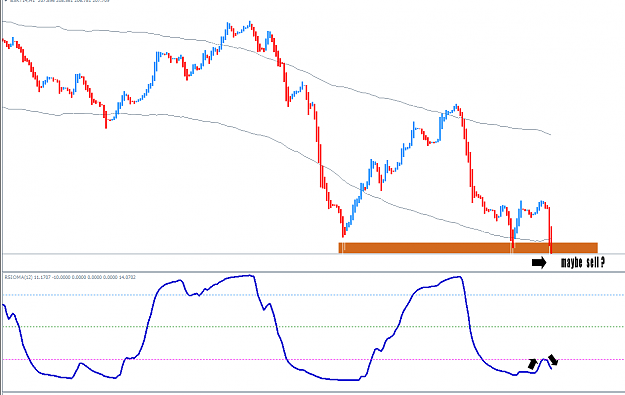
tnavi´s channel of fortune
- lumiche replied Jan 26, 2014
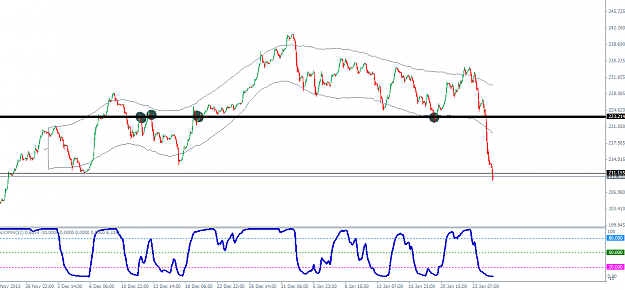
Thanks Tnavi. Here is working. Now waiting to come back, and who knows, pick resistance.
tnavi´s channel of fortune
- lumiche replied Nov 26, 2013
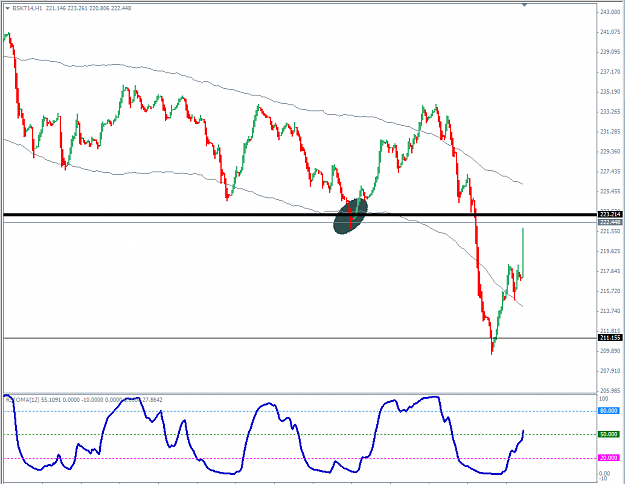
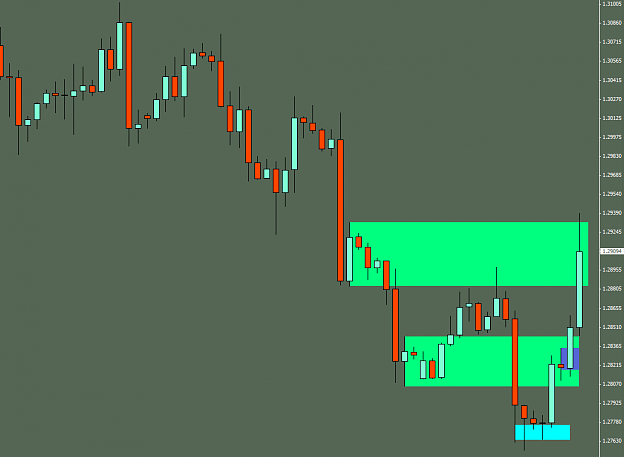
Today I took a look and found that formation. Efeuei sale in breaking the green area, which seemed to be a stand and also because it was near the Ichimoku Clouds
Daytrading/scalping with high leverage - my proven strategy
- lumiche replied Nov 19, 2013
Hello Guys, This is my first post here and English is not my first language . I took the model and the system of DNA and from what I saw , seemed to be very good. Place , and watched how it works . Decided to operate with it , downloaded the LFH ...
Daytrading/scalping with high leverage - my proven strategy
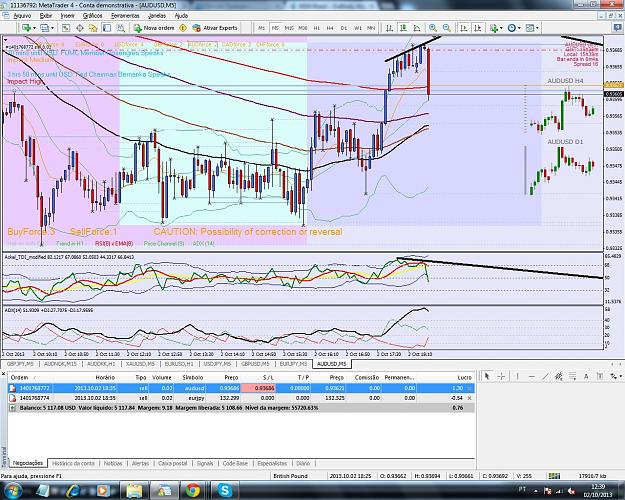
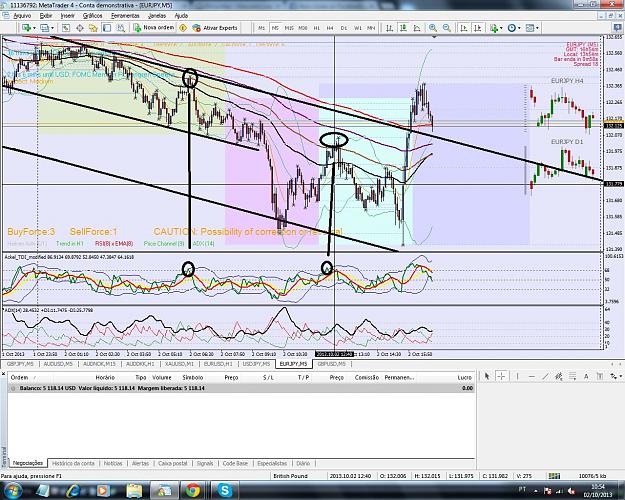
- lumiche replied Oct 2, 2013
Hello Alex, Do not know if it will be operated that way, but I noticed that you can also have a good success rate picking up the points that lie within the emus. Always operating in the mainstream feeling in the moment rsi cuts bb started placing ...
AckelSystem
- lumiche replied Jul 10, 2013
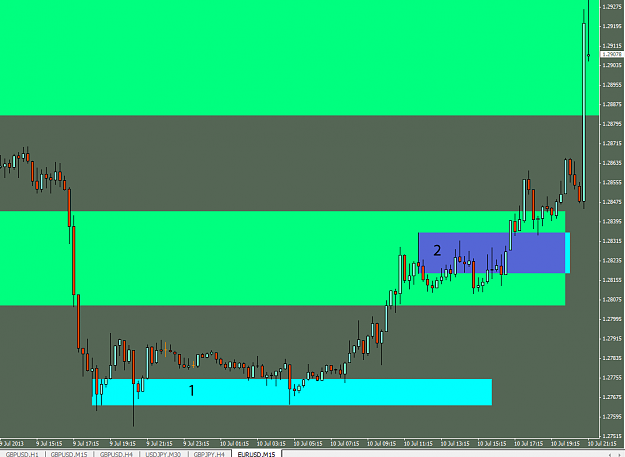
My first post in the group that I follow some time. I have some questions related to the use of the MR system Given, it is better to put images with ease. In this image, I have two green areas that are by my understanding PTZEC areas. I just wanted ...
Price Action in Day Trading by Dadas
- lumiche replied Apr 7, 2013
Now it looks like this. Let's see how many pips this week goes.
4H Box Breakout

- lumiche replied Mar 10, 2012
Image — Correct if wrong. These entries are valid? Are hammers. I made a change and put in rsi to 30 and 70. Appeared more buy signals and in some cases, such as E / U entries were good too.
RSI Divergence with Bollinger Bands
- lumiche replied Mar 6, 2012
Below is an image where the black arrows in both the chart as the indicator, showed where you should have bought. The TF is 4 hours. Let's wait and wait for what may happen in the coming hours.
My own developed benkyalate system
- Posts by Member Search: 'lumiche'