- Search Forex Factory
- 133 Results
-
 kthrapp350 replied Apr 6, 2024
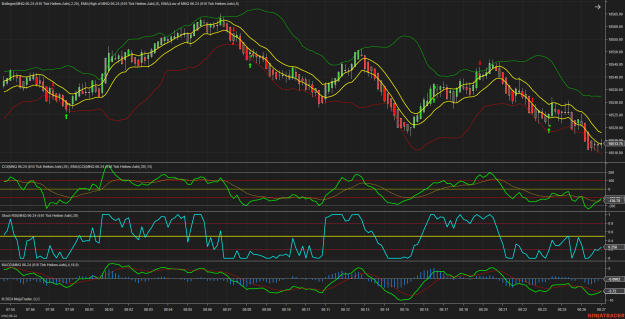
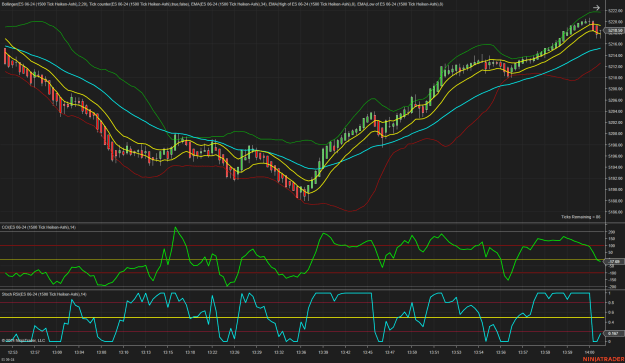
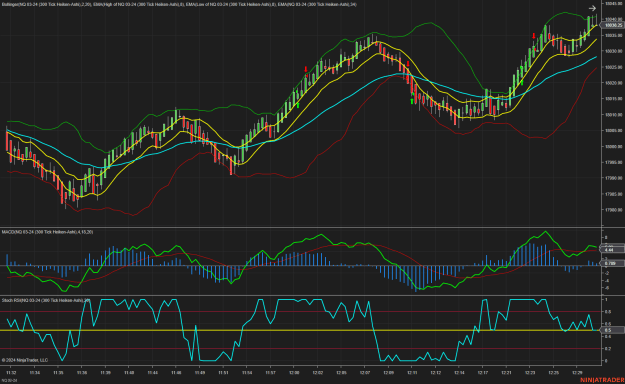
The yellow Ema's are 12 periods set at high, 12 periods set at low and then a 12 period (blue) in the middle. Price has to close above or below the band to go long or short. The Macd has cross in the same direction. I use the CCI and Sto-rsi also. ...
Make Trading simple!
- kthrapp350 replied Mar 22, 2024
I have been in and out all week with appointments for my Son. So today I have just traded the MNQ. Small 5 point trades. So today 40 points so far. Which is not that big of a deal with the small tick size of the MNQ. I am just getting used to the ...
Make Trading simple!

- kthrapp350 replied Mar 22, 2024
I have been in and out all week with appointments for my Son. So today I have just traded the MNQ. Small 5 point trades. So today 40 points so far. Which is not that big of a deal with the small tick size of the MNQ. I am just getting used to the ...
Williams%R, SAR X-over 15 minute candles
- kthrapp350 replied Mar 22, 2024
That sounds good Verde. I have special needs son. He has been keeping my busy this week. So I have not been in front of my screens a lot. I miss the first hour or so of trading and then have to leave with a couple of hours to go. So today I traded ...
Make Trading simple!
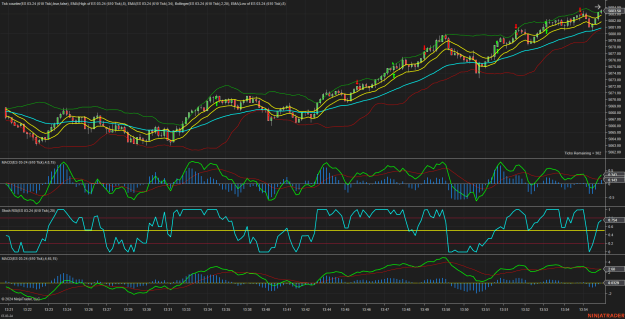
- kthrapp350 replied Mar 18, 2024
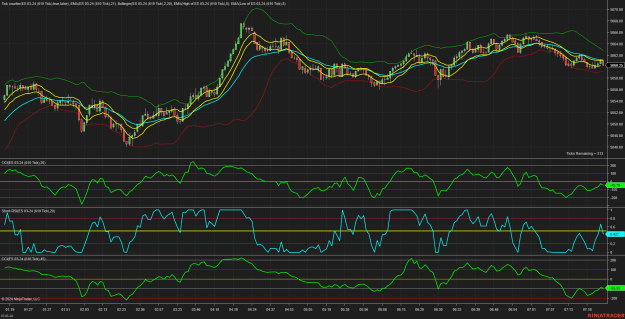
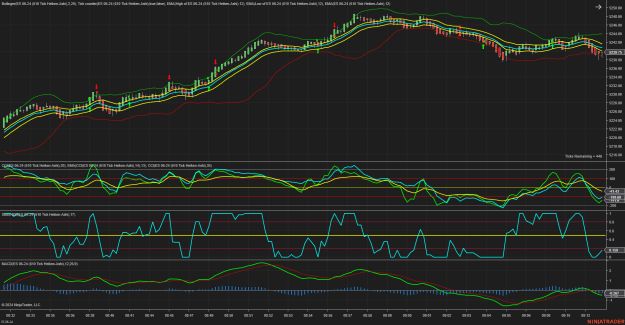
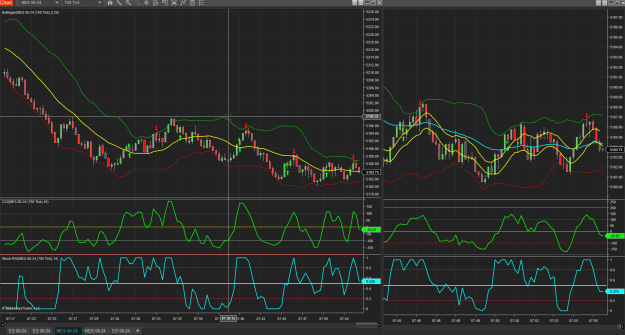
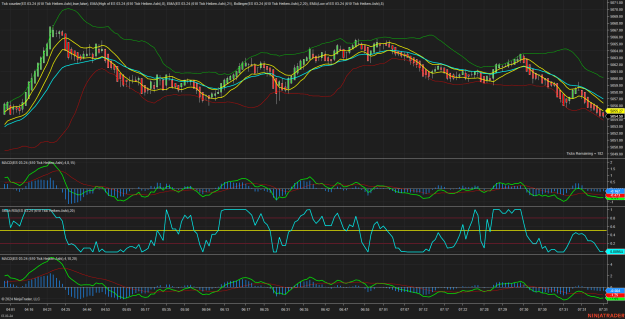
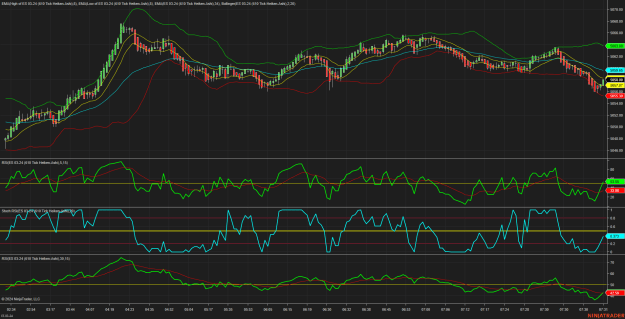
These are my charts from Friday morning. This is what I will be trading all this week. these two chart are on the MES and the one is a 700 tick chart with at CCI at 10 and the Sto-Rsi at 14. The second chart is a 275 tick chart with the CCI at 20 ...
Make Trading simple!
- kthrapp350 replied Mar 12, 2024
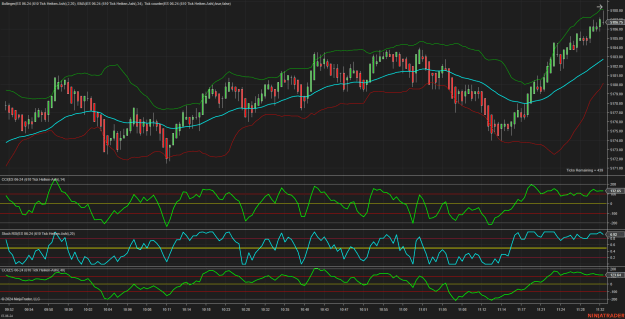
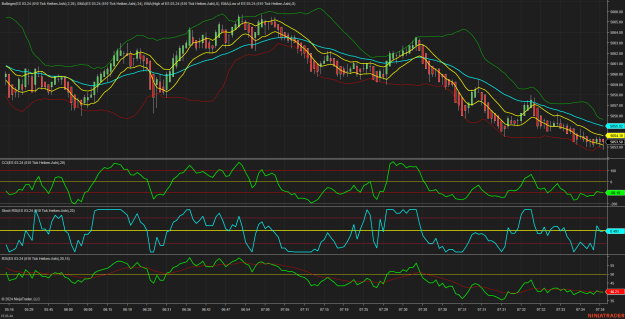
Hey Verde Post a pic of your chart. This is one I have been trading lately. Bollinger bands. It deleted the MA in the middle of the bands and replaced it with a 34 ema. Then a CCI at 14 or 20 periods. Then my Sto-RSI set at 20 and then a Longer CCI ...
Make Trading simple!
- kthrapp350 replied Mar 5, 2024
Part of the 610 tick chart from earlier in the day. Show some trades. image
Make Trading simple!
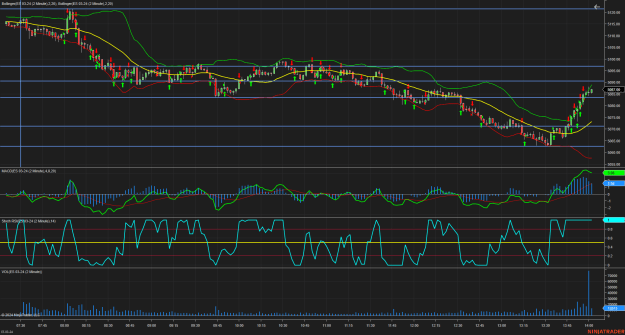
- kthrapp350 replied Mar 5, 2024
So this was my day today. 91 ticks. this is my 2 minute chart. Which I use just to see the big picture for the day. I do noy usually trade off of it. But it shows the whole day with all my trades. I made 32 trades. I think I had 6 loses and 3 B/E's ...
Make Trading simple!
- kthrapp350 replied Mar 5, 2024
Yep Saw this and sat on my hands. because news was coming out at 8:00 my time. I do not do the news. image
Williams%R, SAR X-over 15 minute candles
- kthrapp350 replied Mar 1, 2024
I was in and out all day. traded my favorite chart "old reliable" still managed 63 ticks. So happy weekend everyone image
Williams%R, SAR X-over 15 minute candles

- kthrapp350 replied Mar 1, 2024
Still my favorite chart. Traded this today. Pretty good day, 63 ticks. I was in and out of my office. image
Make Trading simple!
- kthrapp350 replied Feb 26, 2024
Made 3 NQ trades this last hour. +63 ticks. Everything is on the charts image
Make Trading simple!

- kthrapp350 replied Feb 26, 2024
I made 3 NQ trades today. I agree Time or tick charts for the NQ. They are easy to trade. So here are my three trades in the last hour +63 ticks. So my bad. Normally when I trade the NQ I use a 300 tick chart not the 610. This is due to the volume ...
Williams%R, SAR X-over 15 minute candles
- kthrapp350 replied Feb 22, 2024
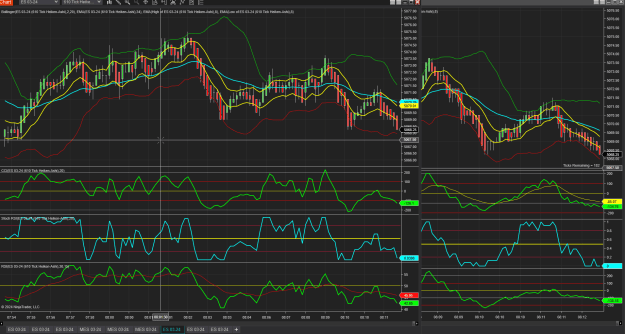
this is my trading screen. 610 on top and the 233 behind. image
Make Trading simple!
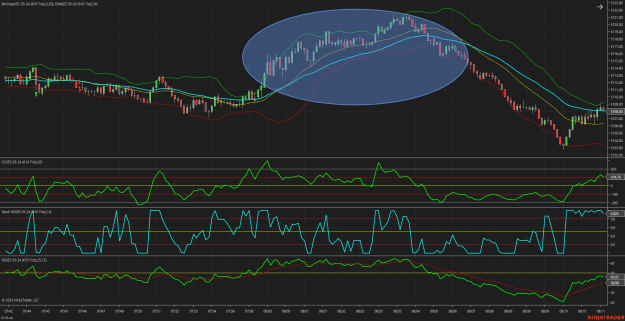
- kthrapp350 replied Feb 22, 2024
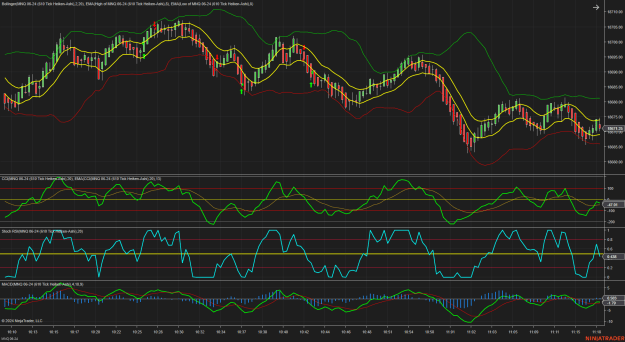
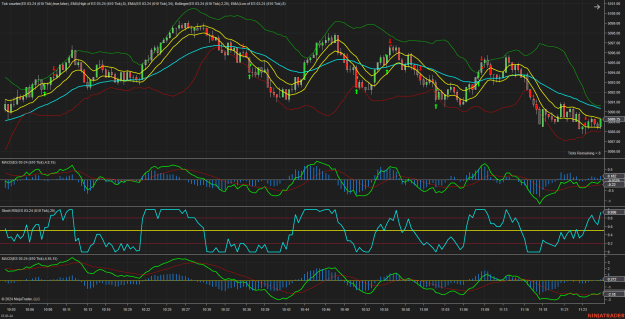
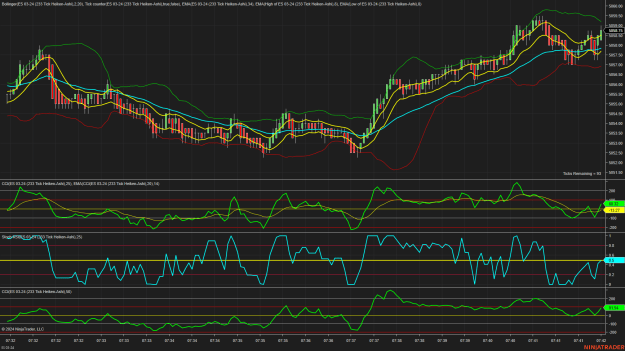
my current 233 tick chart With CCI at 20, Sto-Rsi at 25 and a longer CCI at 50 periods image
Make Trading simple!
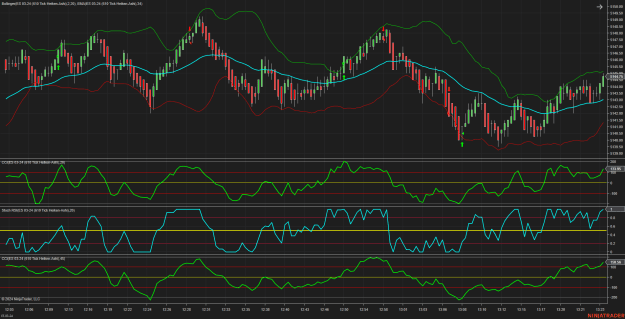
- kthrapp350 replied Feb 22, 2024
RSI and CCI working together with Sto-Rsi. Again on all these charts I am using the zero of 50 line as a signal. These are the 610 tick charts. I have the same setting on the 233 chart that is up beside these. But you can use longer or shorter time ...
Make Trading simple!
- kthrapp350 replied Feb 22, 2024
That is correct. Sto-Rsi does not work well by it's self. But when the CCI is crossing above the zero line, we want the Sto-Rsi to being doing the same. If the Sto-Rsi and the CCI do not agree, then the trade usually goes nowhere. CCI is better at ...
Make Trading simple!