- Search Forex Factory
- 6 Results
-
 jlongo replied Aug 16, 2020
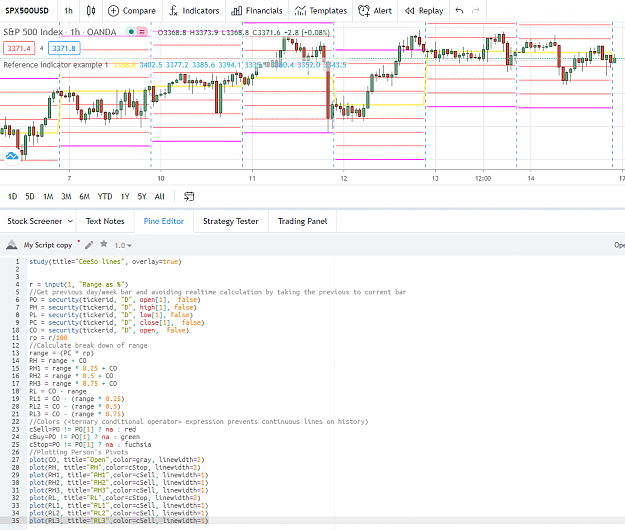
Seems that you copy/past wrong lines... The script starts in: study(title="CeeSo lines", overlay=true) And ends in: plot(RL3, title="RL3",color=cSell, linewidth=1) Regards JL Edit: Example working in what ticket you are trying... image
What I learned after losing $300,000 trading forex
- jlongo replied Aug 12, 2020
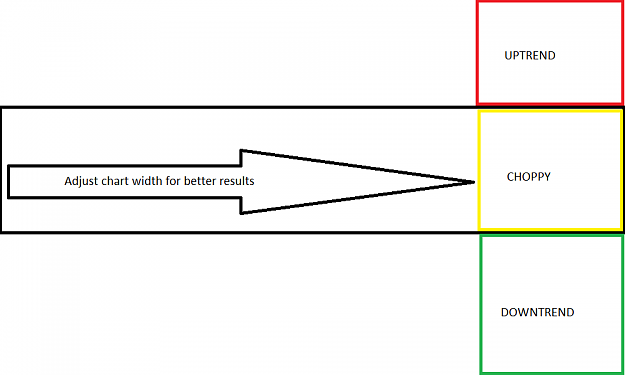
the chart is the best indicator... image
Any indicator that tells when Choppy/Ranging starts/ends?
- jlongo replied Oct 26, 2016
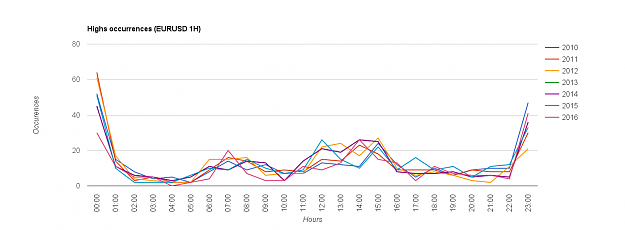
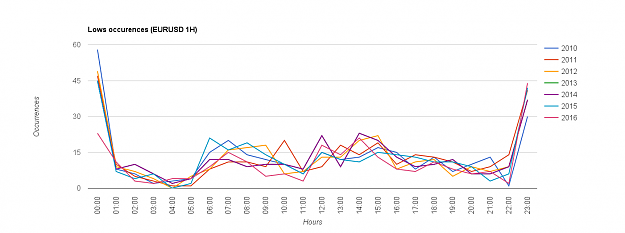
Hi all I have read the book "The logical trader" from Mark Fisher and on this book on ACD system, he says that the open range (that can be from 5m to 1h) depending on asset in consideration represent 20% of the highs or lows for the day. As he ...
How to predict markets, Catch the moves at value
- jlongo replied Oct 9, 2016
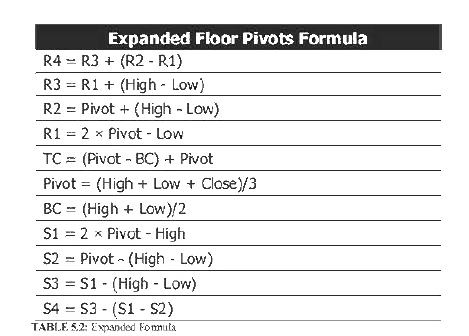
I made a fast try creating a extended pivot indicator (daily period) for mt4, not a great thing, but better than nothing. My first indicator for mt4... JL
How to predict markets, Catch the moves at value
- jlongo replied Oct 9, 2016
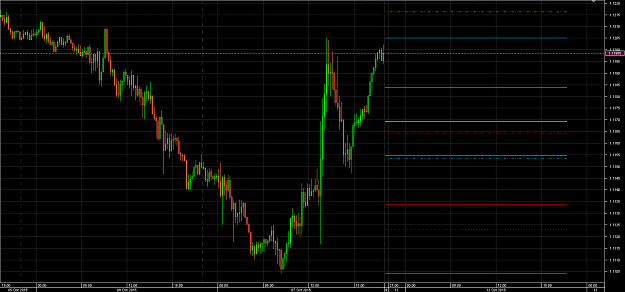
I've made a first version (i'm not satisfied yet with it but it does what i pretend for now) of the pivot levels indicator for jforex where it draws the following levels: Monthly pivots of last month plus PH/PL/TC/BC (dot lines) Weekly pivots of ...
How to predict markets, Catch the moves at value
- jlongo replied Sep 12, 2016
CPR is the equivalent to TC/P/BC on image JL
How to predict markets, Catch the moves at value
- Posts by Member Search: 'jlongo'