- Search Forex Factory
- 9 Results
-
 hytham replied Sep 1, 2010
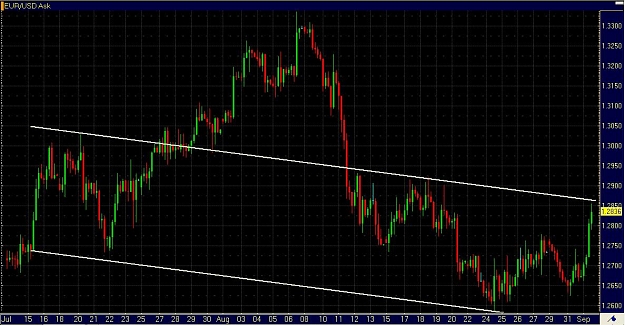
Hi everybody, Got this chart on my screen (EU HR4). I do not know if it makes sense, but it seems that pair reached the top of the drawn channel... Could we say that the pair would start bearish channel soon.... If it does, do we expect to see 25XX ...
EURUSD
- hytham replied Aug 31, 2010
H&S on MN15 Chart — Hi every body... H&S on MN15 chart in formation. Break of 660 confirms the H&S, might move down to 630 and eventually 605. Seems there is more bearish potential during Asian session...
EURUSD
- hytham replied Aug 26, 2010
Looks like we are in a trading range atm btween 690 and 760 edit: attached chart is HR1.
EURUSD
- hytham replied Aug 26, 2010
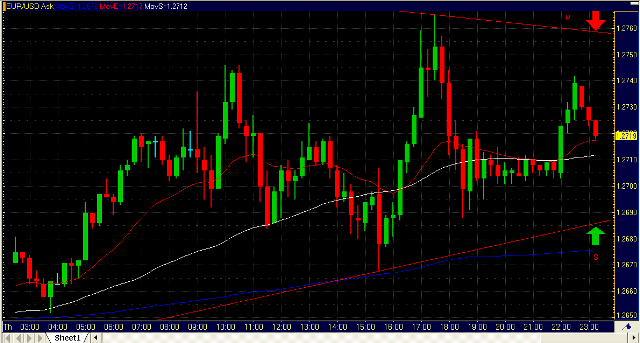
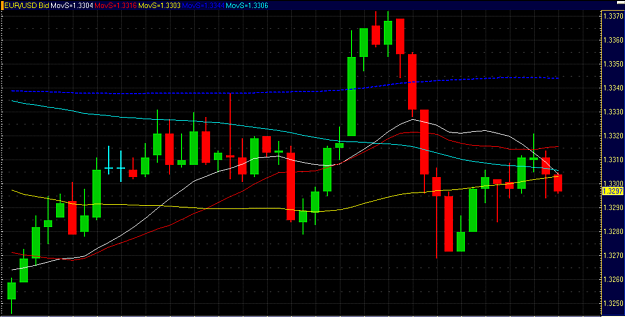
Candle at HR4 — I am not expert in translting candles, but can smebody explain the one on the HR4 chart photo... Is it Doji, does it mean reversal to downside?
EURUSD
- hytham replied Aug 20, 2010
This signal will only indicate the next possible move, market direction, and therefore traders strategy.... http://www.investopedia.com/terms/d/deathcross.asp Normally, trades shall not be positioned until confirmation of price move is in direction ...
EURUSD
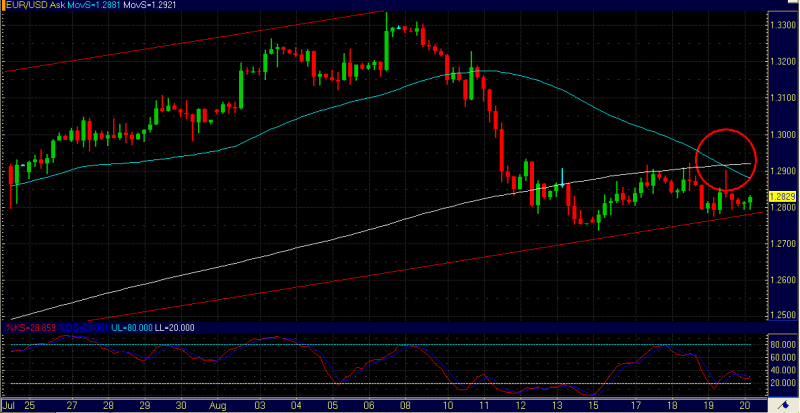
- hytham replied Aug 20, 2010
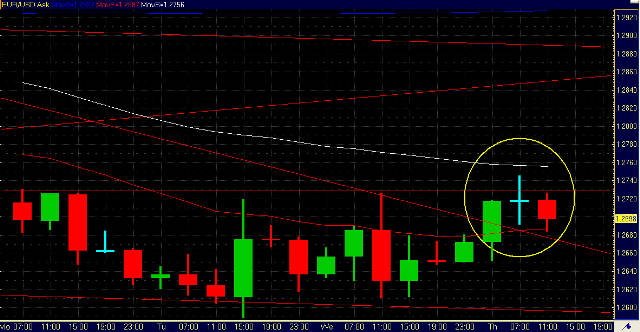
Death Cross on HR4 Chart — Hi everybody, Just seen something on the HR4 chart and wanted to share it with you all.... Cross of SMA 50 and 200..... Some people call it the DEATH CROSS In anyway, it is a negative sign.
EURUSD

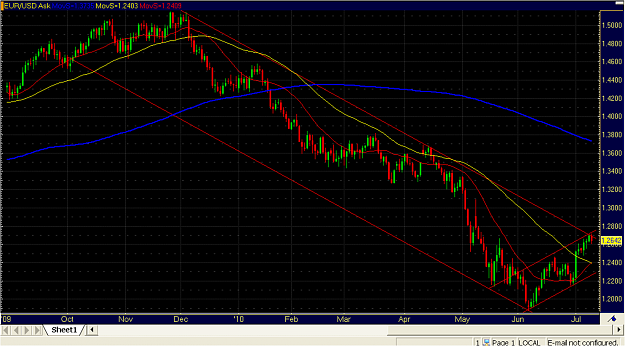
- hytham replied Jul 9, 2010
EUR/USD pair is still in downtrend in daily chart since Dec 2009. See attached pic... 2700 completes the top of the flag formation, which leaves for either: 1- The flg formation would indicate continuation of downtrend. We would have to wait and see ...
EURUSD
- hytham replied May 6, 2009
Is that Head & Shoulders formation? — on 15 mts chart, is that head and shoulders formation? What if it breaks 3270? Ae we going to see 3170?
EURUSD
- Posts by Member Search: 'hytham'