- Search Forex Factory
- 26 Results (1 Thread , 25 Replies )
-
 hazelj80 replied Jul 12, 2022
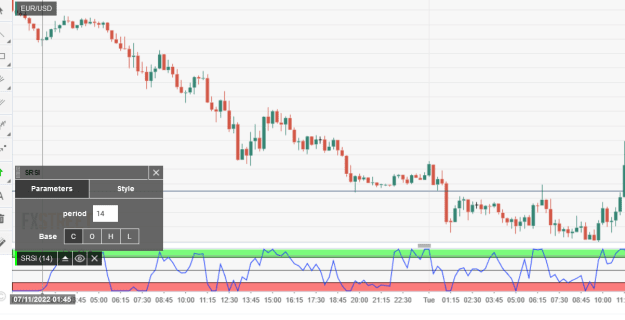
do you know about the code in this indicator? cant find a stochRSI like it
I will code your EAs and Indicators for no charge
- hazelj80 replied Jun 24, 2022
they are different. its called CHN50 the other is HK33 aka china 50 and hang seng 33
FTMO - For serious traders

- hazelj80 replied Feb 26, 2022
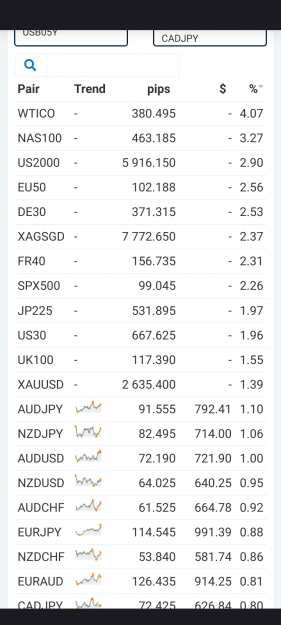
Exactly look at this list. These are 4 week (21 day) Atrs Not one currency pair makes into the top 10 percentage wise
People still trade forex?
- hazelj80 replied Jan 19, 2022
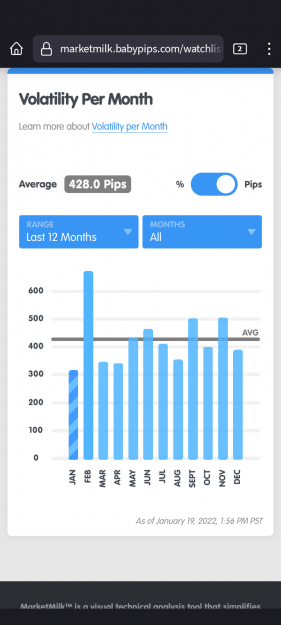
I've never posted in this forum but it does line up with the average monthly ADR. He's close jus not for January but Feb
Cable Update (GBPUSD)
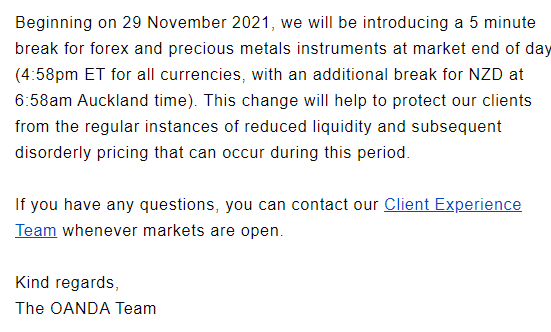
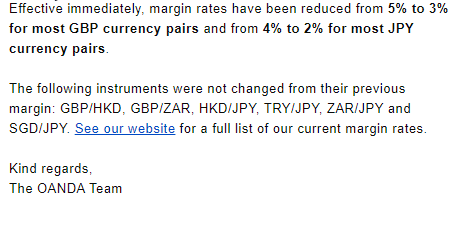
- hazelj80 replied Aug 19, 2021
Well well well looks like they lowered their margins on GBP pairs. noce!! im staying. we only got 3 choices as US citizens forex.com didnt like em back in the day IG And these guys again this is why im trying to hone in on day trading skills and not ...
OANDA Discussion
- hazelj80 replied Jun 30, 2021
In your account settings (if you're live) click on pricing options and you can switch it then close MT4 and re open it. there will be the regular quotes and the ones with the suffix -5 the -5 quotes are the core pricing quotes.
OANDA Discussion

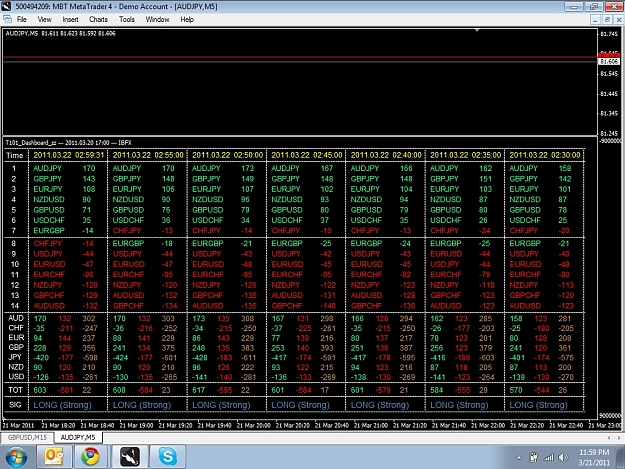
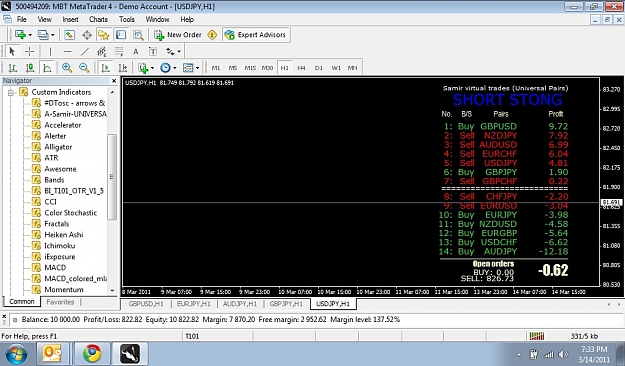
- hazelj80 replied Aug 29, 2011
your answer is in the picture.... looks like you got usd/jpy right
Most ranging Pairs?
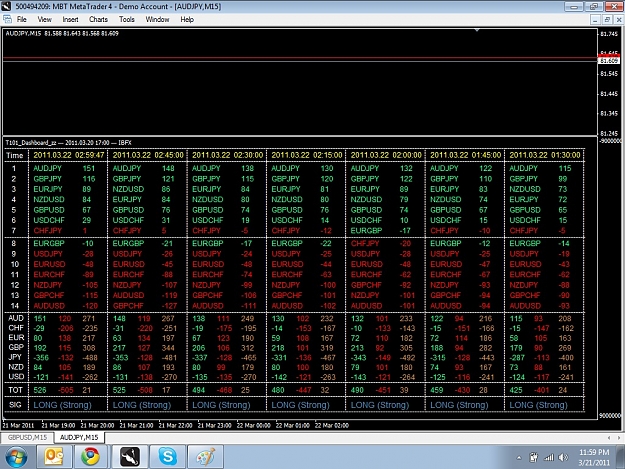
- hazelj80 replied Mar 16, 2011
i know right!? i need to go back live! now i see the patterns and know where a reversal is just by looking at the dashboards when it does alert me. somewhere like 6500 pips. and that's if you're trading just on direction. i only traded one day this ...
Indicators development for T101's not very simple method
- hazelj80 replied Mar 14, 2011
now, i think i get what Julius said now. we were fools to think we could trade all 14 together and then know what were are doing. WE WERE WRONG! we were trying to ride a 1300CC hayabusa without even having ever rode a motorcycle. i would do what ...
Indicators development for T101's not very simple method
- hazelj80 replied Sep 29, 2010
hey zz, do you know why the live and history chart would show different? the first chart was made by the history onl;y script. the second picture was made by the live updating charts. not suer what i did wrong but i set the pip size on both to 100 ...
Indicators development for T101's not very simple method
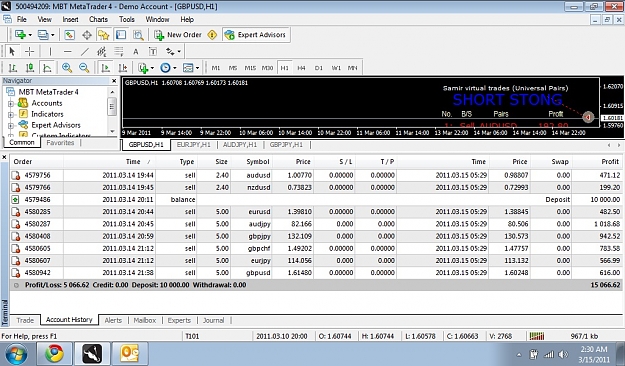
- hazelj80 replied Aug 24, 2010
I'll have to cosign what disbellj just wrote. i have tried all the variations in here and even though Kos entries are very good. theres nothing like good 'ol price action. and it's up another 1000 pips in this picture. you need only one indicator ...
Indicators development for T101's not very simple method
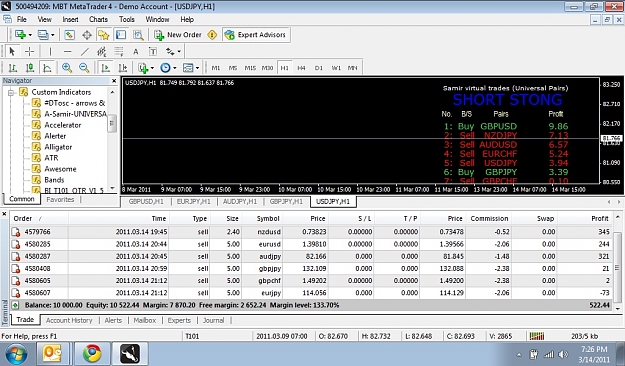
- hazelj80 replied Aug 12, 2010
you should have made at least 1500 this week. you can't see the movment becuase there really is not movmement on one chart. that's why you need to focus on the power of 14. trading less is less volatility. so when people say flat. i say "what?! this ...
Indicators development for T101's not very simple method
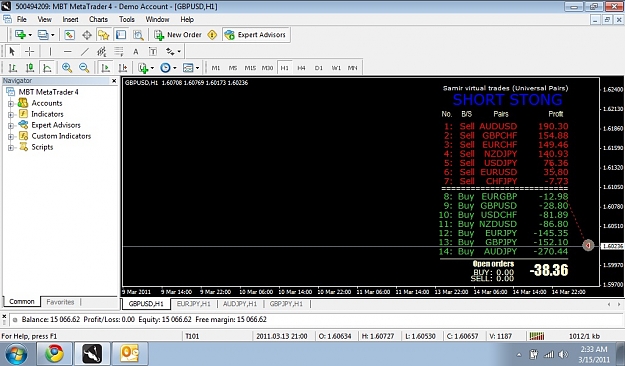
- hazelj80 replied Jul 19, 2010
SELL OFF! — I'm still around just reading now and not very much in the way of posting...it's time to sell! perfect line up! just working on private EA now...no indicators but the ones you see on this chart which are on this thread. they will ...
Indicators development for T101's not very simple method
- hazelj80 replied Jul 15, 2010
yeah dbfx is using the fxcm platform tech, and that's it. fxcm is the white label for dbfx if anything at all. the spreads are lower at dbfx. and here's a Asian session picture of the gbp/jpy to prove this so that everyone who is spreading miss ...
dbFX (Deutsche Bank)
- hazelj80 replied Jun 24, 2010
MTF TRIX — I have been thinking about combining MTF TRIX and using the PL EA to get out of trades. that might be a good EA url the picture is from finimej's off line charts with eur/gbp usd/cad and usd/chf inverted but not using cad pairs. ...
Indicators development for T101's not very simple method
- hazelj80 replied Jun 15, 2010
i do have those MA's on a basket chart that represents 14 pairs. not one. these charts will keep us from making "basket" version of indicators. oh and you're right about LSMA. it's better than trend magic. I just put it on default and got better ...
Indicators development for T101's not very simple method
- hazelj80 replied Jun 15, 2010
@ KOS here's what your strategy looks like on finimej's charts you no longer need the BTR crossover indicator because it's nothing more than the 5/10 MA's crossing over each other. looks a little cleaner. play around with the chart combinations and ...
Indicators development for T101's not very simple method
- hazelj80 replied May 14, 2010
what would cause a chart gap like this one? Ive done everything and looked at all the pairs. my platform was never shut down nor did any pairs have a price gap or price spike. i am at wits end now trying to get it to work properly again EDIT: now i ...
Indicators development for T101's not very simple method