- Search Forex Factory
- 59 Results
- fxeturn replied May 16, 2012
Has anyone spotted this PB? image Daily chart • PPZ @ 1.00600 • Long-term trendline • Hitting Fibonacci level at H4 chart (zoomed out) • Overbought • PB stands out from a 2-week bullish trend image We can see the PPZ far away in daily chart, ...
james16 Chart Thread
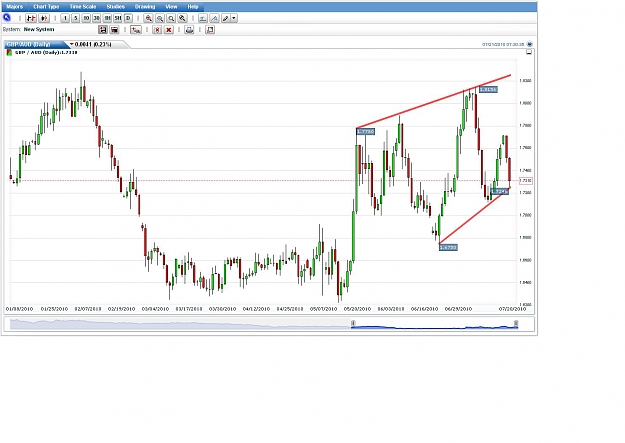
- fxeturn replied Jul 20, 2010
image GBP/AUD is on an interesting area. Let's see what it brings us to.
james16 Chart Thread
- fxeturn replied Jun 22, 2010
I'm still looking though. It looks like it's heading for a retest, although 1.23 looks real strong with all the traffic. image
james16 Chart Thread
- fxeturn replied Jun 22, 2010
Which looks more inviting? — image image BEOB on EU and BUOB on UC, but UC looks more inviting. Supported by VBRN, large space, less traffic, trend continuation. Looks like a viable low-risk entry on BUOB's high with FTA on 1.1176.
james16 Chart Thread
- fxeturn replied Jun 20, 2010
Not sure if this can relate to your post Ghous, but I have this thinking that trading with the trend is always much safer than going against it. This is because retracements happen way more than reversals. Yes some people might profit from every ...
james16 Chart Thread
- fxeturn replied Jun 18, 2010
And so it did close above 1.65. My concern to long this is the fact that it's Friday today. I guess I'll wait till the market opens on Monday. Have a great weekend everyone.
james16 Chart Thread
- fxeturn replied Jun 18, 2010
Didn't realize that. Gasp! I'll have to start making notes! Thanks for the input Mike, and clearing up misused terminologies haha. This thread enjoys what it is today thanks to kind people like you, Jarroo and other seniors who never get tired of ...
james16 Chart Thread
- fxeturn replied Jun 17, 2010
USD/CHF with its fakeys — Anybody played any of these 2 failed PBs? Ironically they happened at the same level around 1.31. While the first one could be a full bar loss (or BE depending on management), the second one might not be triggered ...
james16 Chart Thread
- fxeturn replied Jun 16, 2010
Didn't know that. Now I learned something new thanks to you Dan. By the way the feed is different on my chart so I didn't see a PB. Here's my chart: image
james16 Chart Thread
- fxeturn replied Jun 15, 2010
What about the daily? There's this indecision bar yesterday with confluences of the monthly bar's 50%, BRN and PPZ. Trend is long-term bearish, so it could be returning to the trend. However, no major PA atm, and my concern is that price is at its ...
james16 Chart Thread
- fxeturn replied Jun 14, 2010
Retracing Pairs — Looks like a lot of pairs are retracing atm, but these 3 caught my eye. Confluences are TL, EMA, PPZ, RN. All looking for supports that were previously strong resistances. May PA guide the way... image image image
james16 Chart Thread
- fxeturn replied Jun 11, 2010
AUD/CAD — Looking at the weekly bar now. Possible bullish PB, but still has several hours left to bar close to confirm it. Weekly low at strong PPZ, also with a confluence of a bullish TL that has been respected several times as marked with ...
james16 Chart Thread
- fxeturn replied Jun 10, 2010
Anyone played this BUOB which covered 2 BRNs on Aussie? I passed it because it didn't look like it has a lot of space, but if anyone played it, it worked out real nice hitting 0.85 for 200 pips. Just wondering now if it will repeat the bearish move ...
james16 Chart Thread
- fxeturn replied Jun 10, 2010
image Changed TP to 0.78 after realizing the bearish TL. Target reached. Actually entered this with 3 lots. First target 1.43 reached. Moved remaining 2 lots to BE, seeing 1.42 and 1.41 as next possible targets.
james16 Chart Thread
- fxeturn replied Jun 9, 2010
EUR/AUD daily — 1.45 support breached by the BEOB and yesterday's bar didn't make it although it try to. Confluences are slight divergence, fib, bearish TL. Low risk entry above 1.45, with a couple of targets based on the traffic, 1.43 is ...
james16 Chart Thread
- fxeturn replied Jun 8, 2010
Bearish PB at gold's highest point yet and rejected at 1250. Looking at 1220, 1210 and 1200 as possible targets but the uptrend is really strong. Looking for more reasons to short. image NZD/CHF has made a bullish PB at 0.76, which looks very ...
james16 Chart Thread
- fxeturn replied Jun 8, 2010
Ok thanks. I've seen the term 'touch trades' around but I don't really know the meaning. I'll just stick with basics first. Here's a USD/JPY analysis: BEOB on daily, consolidation on weekly, bearish on monthly. Confluence with 150 EMA. image A ...
james16 Chart Thread
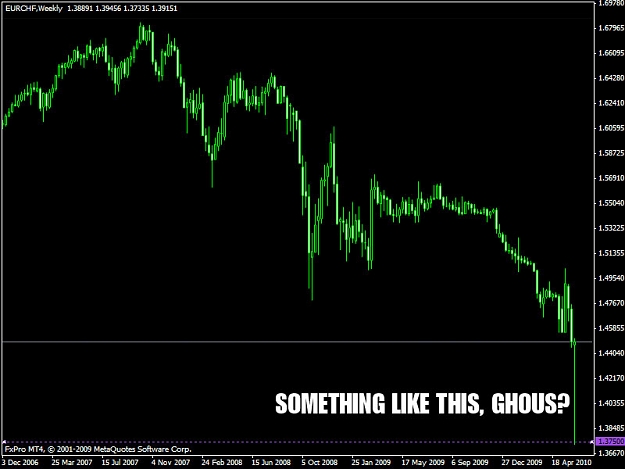
- fxeturn replied Jun 7, 2010
GBP/USD — image My view on this weekly PB is that it could've been better if it looks like the PB of September 2008 (pointed with arrow). That PB was formed at swing high off a retracement in a bearish trend. The current PB looks very ...
james16 Chart Thread