- Search Forex Factory
- 177 Results (1 Thread , 176 Replies )
-
 forex3e replied Sep 22, 2011
since i started case #3 my anticipation works, its time to reap the profits and i'll end here look at case #4 3.618* bc projection 1340x, this works too and i'll end here charts - GJ gL ..
The Gartleys ...
- forex3e replied Sep 6, 2011
let me continue with study case #4 as i have posted too many charts .. this shall be my last and GC has currently reach 2nd barrier 1.38 wish all readers .. all the best ..
The Gartleys ...
- forex3e replied Sep 4, 2011
study case #4 (eu) — if this is a retrace market has complete target #1 @ 14146 ..
The Gartleys ...

- forex3e replied Sep 4, 2011
study case #3 — i am thinking if case#2 is wrong then this next case (#3) could be wrong but lets walk into this trap and see if the market would yield its bidding.. this 4hr anticipate price to go lower (after 12331 next is 1223x) currently ...
The Gartleys ...
- forex3e replied Aug 30, 2011
st resistant levels +/- — break of the 1.618* BC @ 10601 next shown on chart @ 10717 next @ 10905 ; 11021 ; 11209 .. just sharing these short term resistant levels .. gl
AUD/USD
- forex3e replied Aug 26, 2011
price looks all ready at the D point +/- if this 5-0 works, good luck next week
AUD/USD
- forex3e replied Aug 24, 2011
STUDY CASE #2 — For case#1 i would use the term FAILED .. this can be a failed gartley or a failed butterfly - there is no reversal at its 1.618* bc point (128.16).. and price continued to move down ward it formed a CRAB i will show case#2 a ...
The Gartleys ...
- forex3e replied Aug 23, 2011
study case#1 — i feel you may want to study this case.. A @ July 5th, 2011 High 130.84* .. note this is a 4hr time frame failed gartley at point D and price continue onto over 350 pips with a 4.236* BC projection >
The Gartleys ...
- forex3e replied Aug 19, 2011
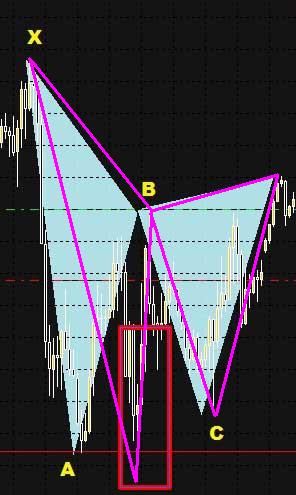
well..this is an Gartley thread afterall — you may like this link > url i use your chart .. you can draw them this way .. in PINK >
The Gartleys ...
- forex3e replied Aug 18, 2011
if you are talking about slippage — on a 4hr tf slippage can be between 10 to 40 pips > url and if you look at higher tf like daily, weekly, monthly expect a much larger slippage between 50 to 250 pips >month chart
The Gartleys ...

- forex3e replied Aug 17, 2011
gc — 1st barrier .. yellow sloping down line 2nd barrier .. white sloping down line good luck ,
GBP/CHF and USD/CHF

- forex3e replied Aug 12, 2011
recent price action chart swissy - no go at harmonic number as price got rejected at the month trend line ..
GBP/CHF and USD/CHF
- forex3e replied Aug 10, 2011
eu — when market is ranging it is difficult to draw them unless you uses a "cut through line" ..
The Art to Draw Correct Trendlines

- forex3e replied Aug 4, 2011
wrong term used .. change monthly to weekly .. sorry "WEEKLY has 069xx (harmonics) 067xx (Papion Method) while vst tf has 074xx."
GBP/CHF and USD/CHF you cant take me video , BRYAN ADAMS "You Can't Take Me" You can't take me Yeah Got to fight another fight ...
- forex3e replied Aug 3, 2011
the truth is it does not matter what i believe although my timing/entry is somewhat a challenge to others
GBP/CHF and USD/CHF we are after all at different level.. oops UJ jumped!
- forex3e replied Aug 2, 2011
not picking bottom but.. — gc @ 12389 swissy resting @ 07609 thought i share my support levels and let you decide what to do if i look at the monthly chart.. cant really tell price @ lt tl.. this thing could end a tap lower ehh.. depend on ...
GBP/CHF and USD/CHF