- Search Forex Factory
- 90 Results (1 Thread , 89 Replies )
-
 ciptard replied Jan 5, 2015
EURUSD H1, TP at one of those red lines, SL just above the previous candle high. image I'm currently on vacation, still can't post many things here, including my first and second formula. Sorry for that. Happy green pips for all! UPDATE : Forgot ...
EURUSD Trader's Journal
- ciptard replied Jan 4, 2015
Yes, of course! Thanks for mentioning that one, I'll try it. Sorry, I haven't replied your message yet, will catch up later. Anyway, the movement of EURUSD on the first 3 minutes was crazy, it was up to 82 pips (on my broker). image
EURUSD Trader's Journal
- ciptard replied Dec 30, 2014
EURUSD H1 : for this kind of patterns, the next big move usually happens after crossing one of these lines image
EURUSD Trader's Journal
- ciptard replied Dec 30, 2014
Looking forward to it.
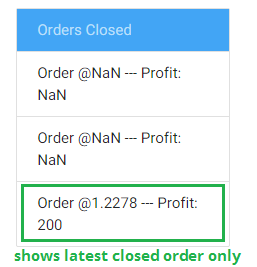
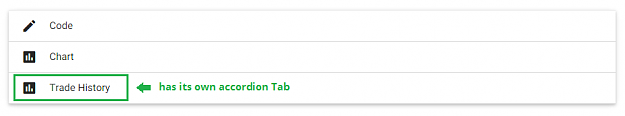
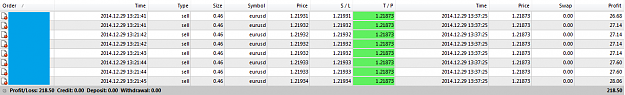
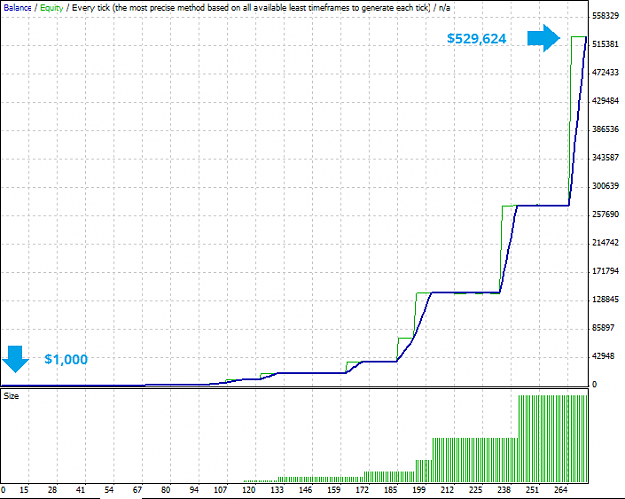
Need Your Suggestions on My Trading Simulator and Backtester I've downloaded your Trading Simulator and tested it. More suggestions : I think it's better if the orders closed only shows the latest closed order, while the other has its own accordion Tab. See screenshots below ...
- ciptard replied Dec 29, 2014
The same pattern, it's just the opposite, bullish vs bearish. image
EURUSD Trader's Journal
- ciptard replied Dec 29, 2014
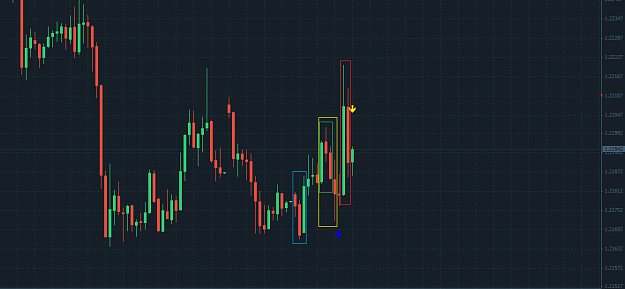
For those who are following my thread, you might want to see these. There were 4 patterns occur today. The last three of them occured when I was sleeping and I already turned off my PC. image These are my favorite patterns : blue box : bullish ...
EURUSD Trader's Journal
- ciptard replied Dec 28, 2014
First TP has been hit. I think the second is a false signal since it's a SELL below previous D1 Low, and more, one of my favorite patterns occurs there. image But I'm not sure, price currently at strong support level. Let's just see what will ...
EURUSD Trader's Journal

- ciptard replied Dec 26, 2014
I'll post my EA Third Formula v1.5 in the next few hours for all testers who have requested to me via this thread or PM. Tester is now closed! No more requests will be served! I've opened a new live account on FBS (this one is Cent account) starting ...
EURUSD Trader's Journal
- ciptard replied Dec 24, 2014
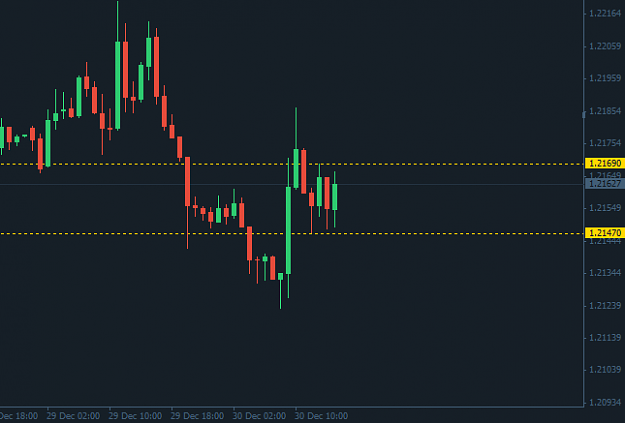
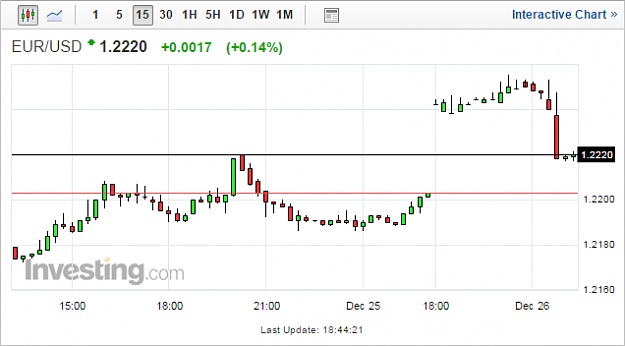
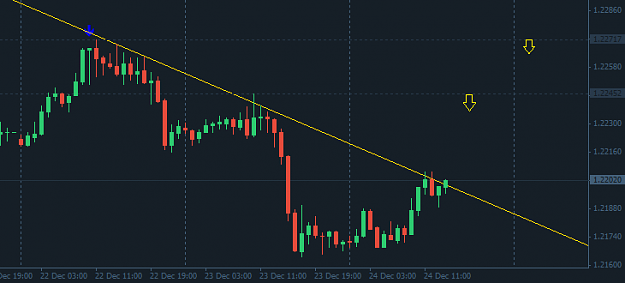
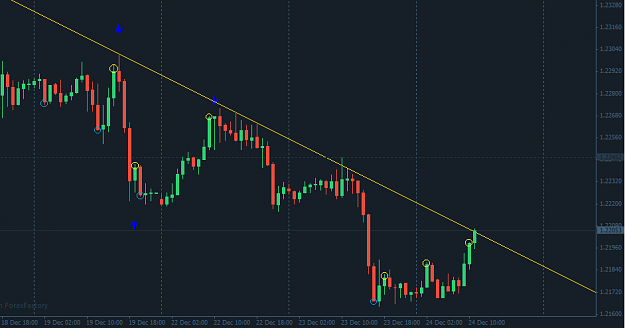
If the price go above 2206, possible retracement is 2245 or 2271 before going down. Overall trend is still bearish. image
EURUSD Trader's Journal
- ciptard replied Dec 24, 2014
It's bearish already. If you did go short, it's always better if you put your SL at breakeven, that way you'll lose nothing if the price bounce back. image
EURUSD Trader's Journal
- ciptard replied Dec 24, 2014
I just finished type it all together, and then the last candle already turned into pin bar, LOL image
EURUSD Trader's Journal
- ciptard replied Dec 24, 2014
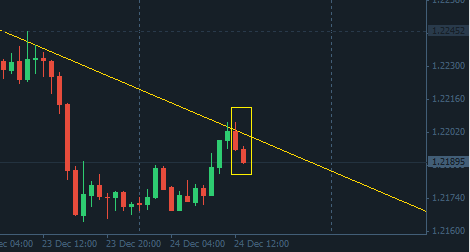
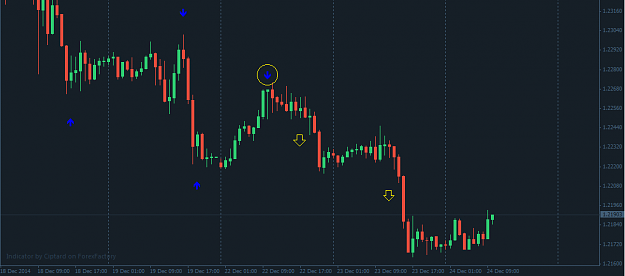
image notice all the yellow circles above? It works like this : the previous candle is strong bullish the next candle is still a strong bullish with small nose (yellow circle) then it's more likely the next candle will turns to bearish, or if any, ...
EURUSD Trader's Journal
- ciptard replied Dec 23, 2014
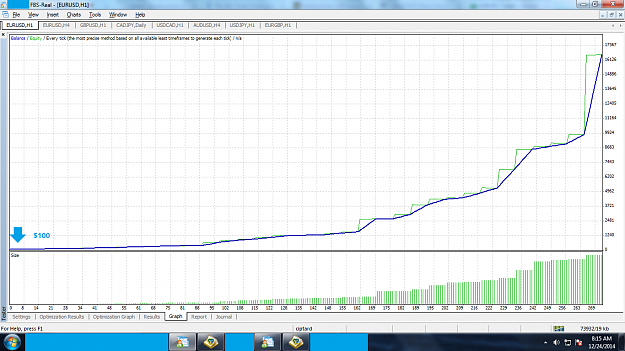
EA Third Formula v1.5, revised my EA, added some new features and put my EA to the extreme image DD is quite high : 55% but if we talk about risk, that's just $100 new features added : trailing stop / SL at breakeven use MA as EXIT (still doesn't ...
EURUSD Trader's Journal
- ciptard replied Dec 23, 2014
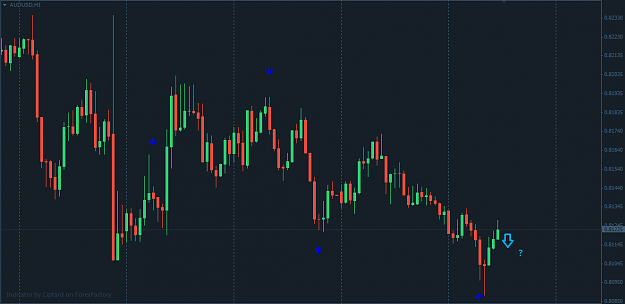
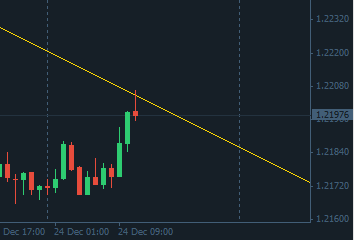
BUY signal from my third formula indicator on AUDUSD H1 image may be right, may be wrong, but I don't take a ride.
EURUSD Trader's Journal
- ciptard replied Dec 23, 2014
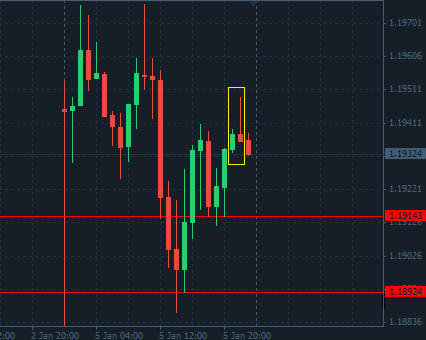
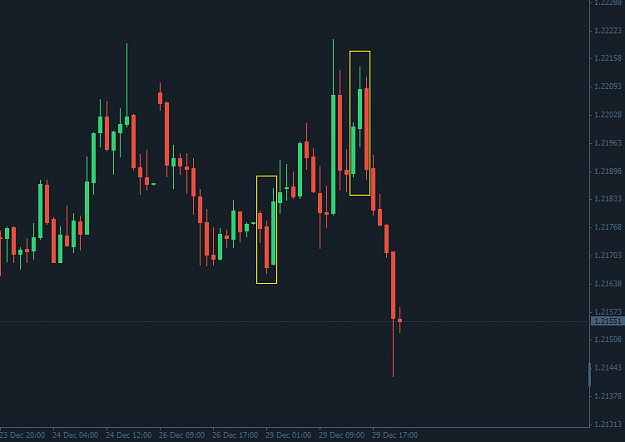
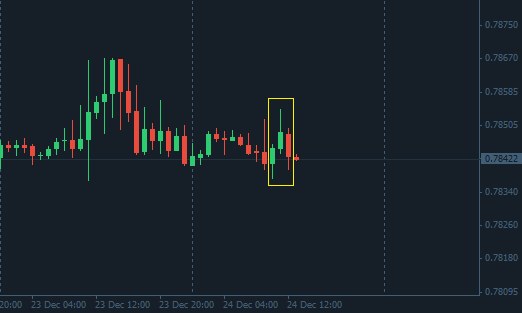
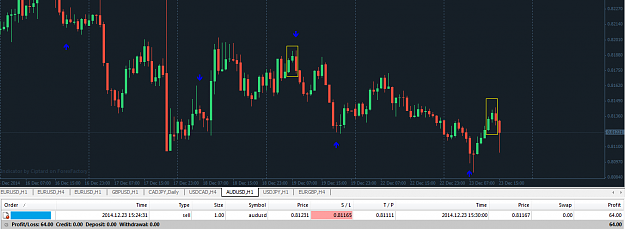
I just couldn't stand not to make some easy pips (AUDUSD H1), but unfortunately that spike hit my trailing stop. image Anyway, I haven't added this pattern to my third formula. See the yellow boxes.
EURUSD Trader's Journal
- ciptard replied Dec 23, 2014
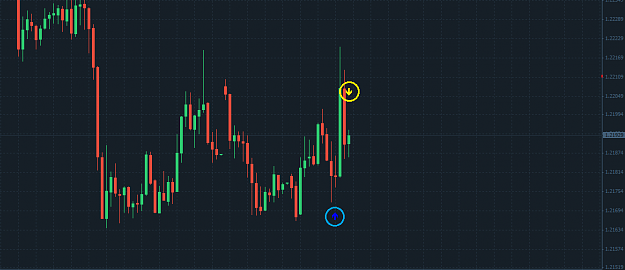
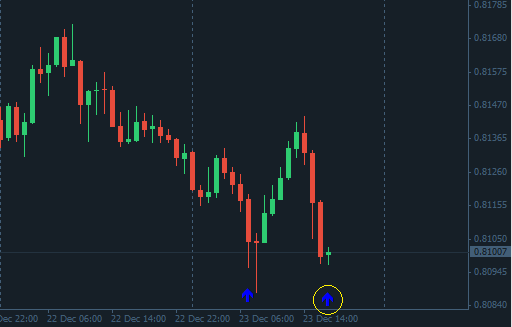
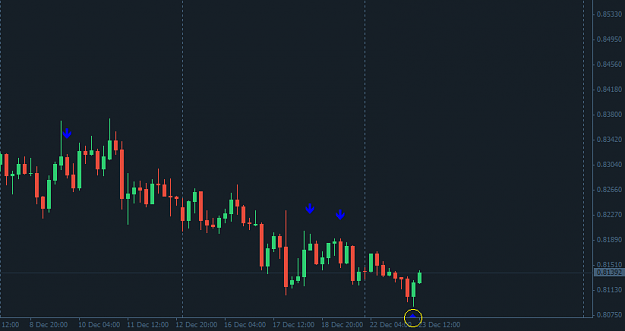
I just realized that my third formula indicator gave a BUY signal on AUDUSD H4 a few hours ago. Didn't see that one coming. See the yellow circle below. image
EURUSD Trader's Journal
- ciptard replied Dec 23, 2014
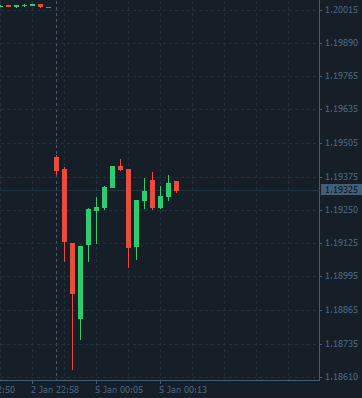
AUDUSD H1 image Please note that it's just a random post, I don't actually trade AU
EURUSD Trader's Journal