- Search Forex Factory
- 30 Results
-
 caparzo replied Mar 16, 2014
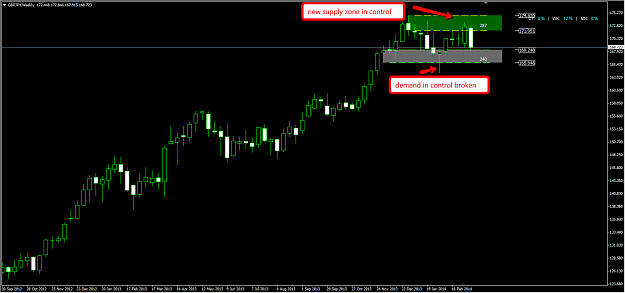
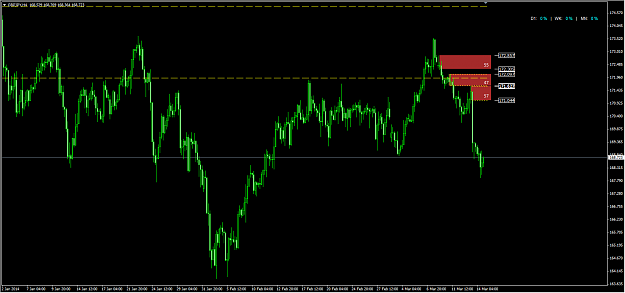
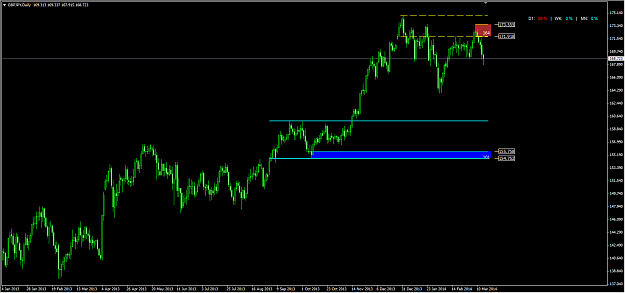
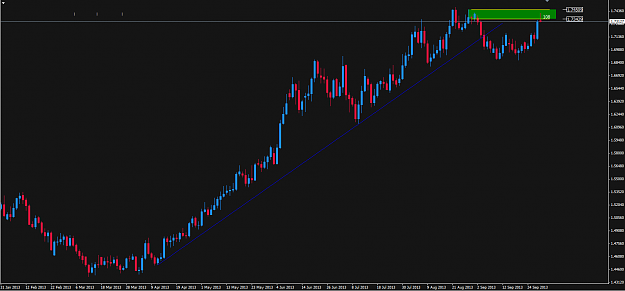
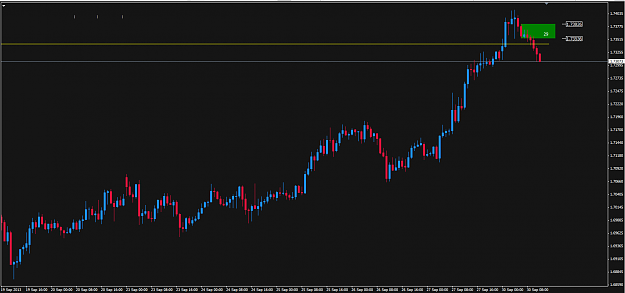
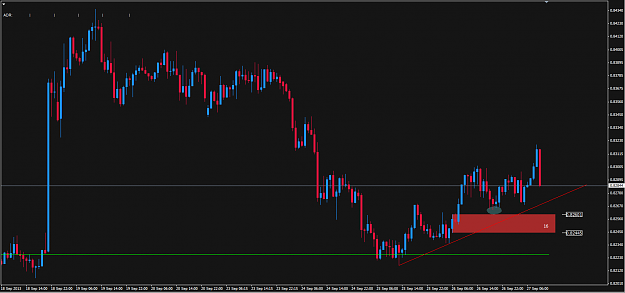
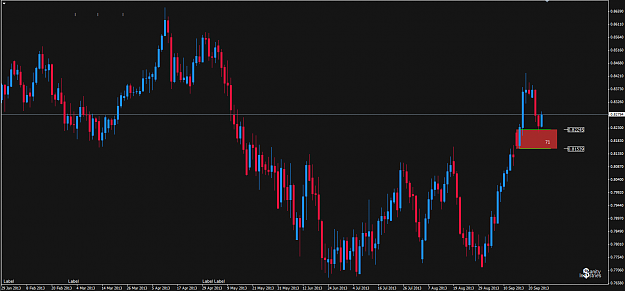
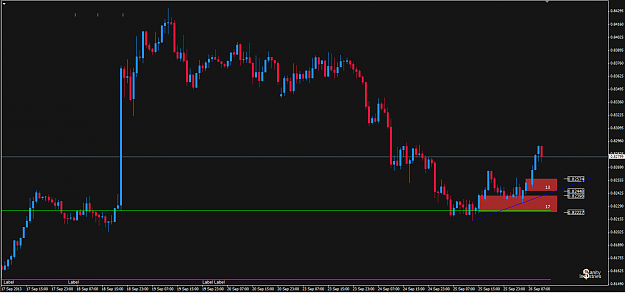
Hi Alfonso and everybody, as seen on GBP/JPY weekly chart (HTF) since the demand in control has broken solidly, is it good to short 4H levels (LTF) in new weekly supply zone? thanks weekly image daily image 4H image
Supply and demand in a nutshell by Alfonso Moreno
- caparzo replied Nov 7, 2013
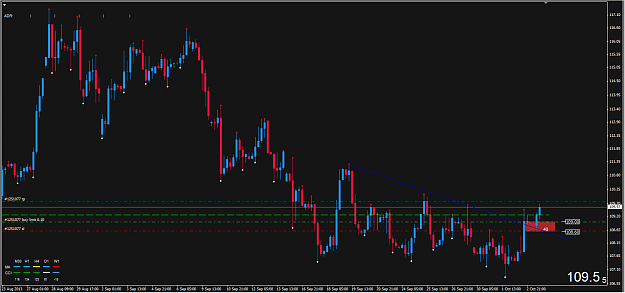
yes i got you, but i didnt mean that, i know these 2 Daily zones are not valid for current price, what i am asking is; would you have taken these 2 zones when the Price were like shown in the pics.
Supply and demand in a nutshell by Alfonso Moreno
- caparzo replied Nov 7, 2013
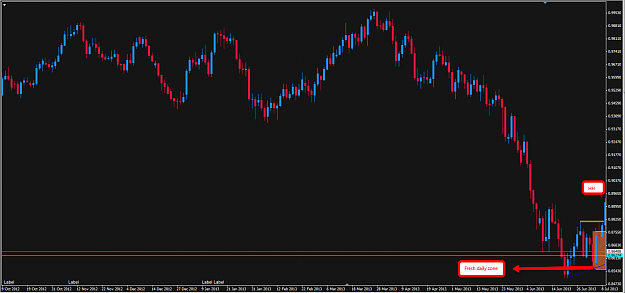
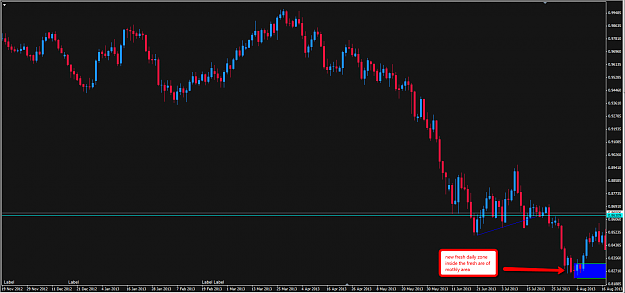
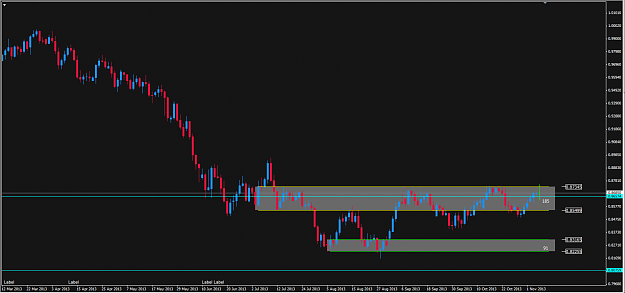
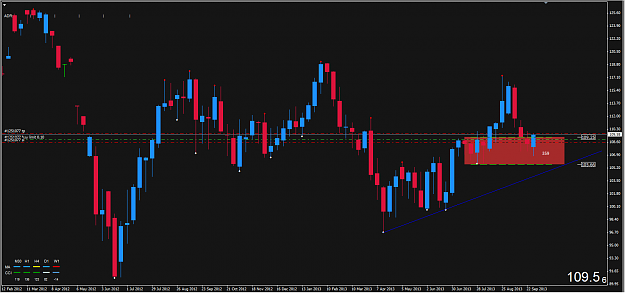
Hi to all, Hi Alfonso, using monthly and Daily combo, i want to ask if these two Daily demand levels ,which are inside the monthly demand zone, were valid or not according to confirmation type of trading?
Supply and demand in a nutshell by Alfonso Moreno
- caparzo replied Oct 22, 2013
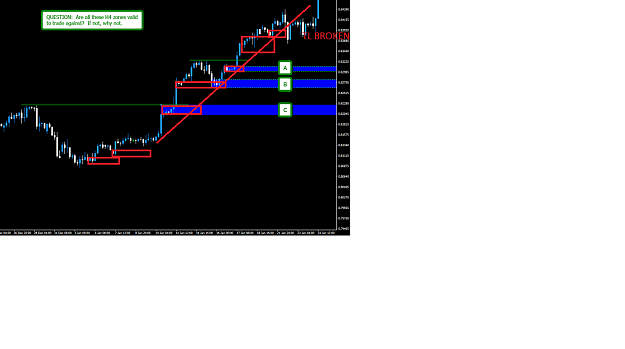
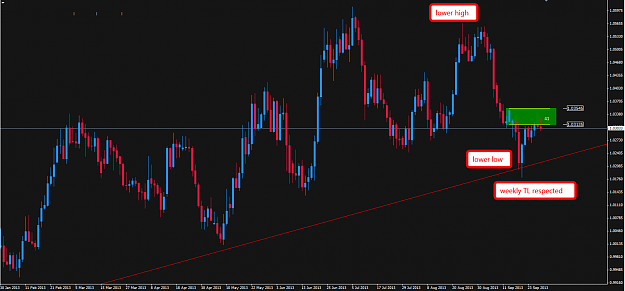
i asked this info because, in this case (pic) if your HTF analysis let you to take 4h long setups, you can take all fresh 4H levels that are with respect to your 4H TL. Once the TL is broken, you are not allowed to take long setups unless it is ...
Supply and demand in a nutshell by Alfonso Moreno
- caparzo replied Oct 10, 2013
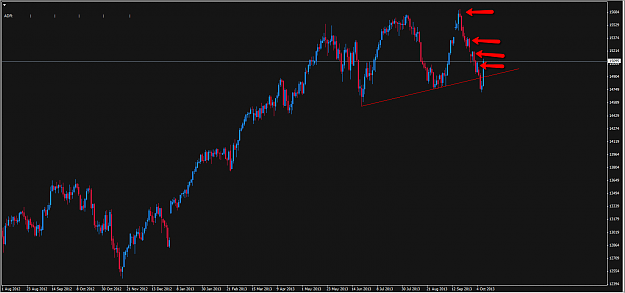
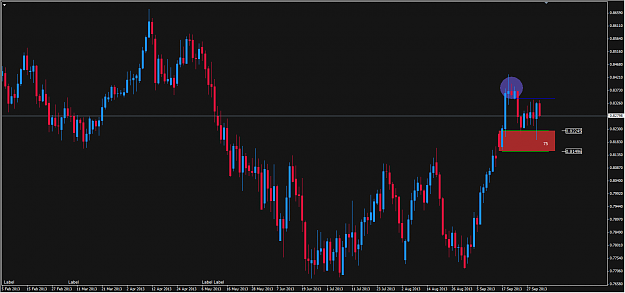
Hi Alfonso and traders, i am abit confused to select which Daily levels on US30 Daily chart, all looks CPs and fresh. i draw 4 possible supply levels but which ones to choose is abit difficult for me. i am waiting your comments. thanks in advance...
Supply and demand in a nutshell by Alfonso Moreno
- caparzo replied Oct 9, 2013
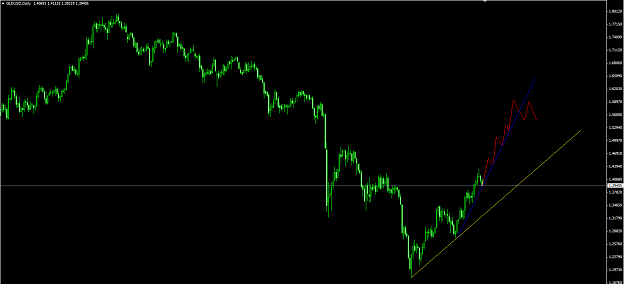
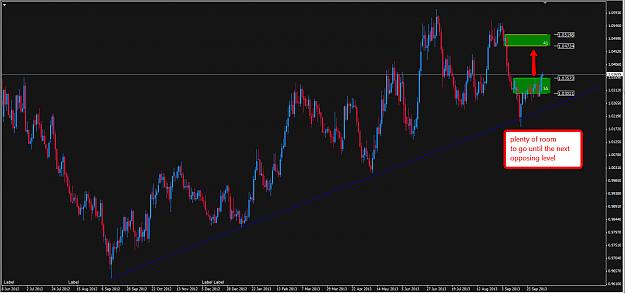
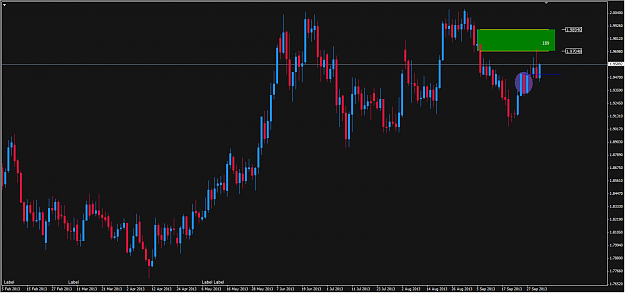
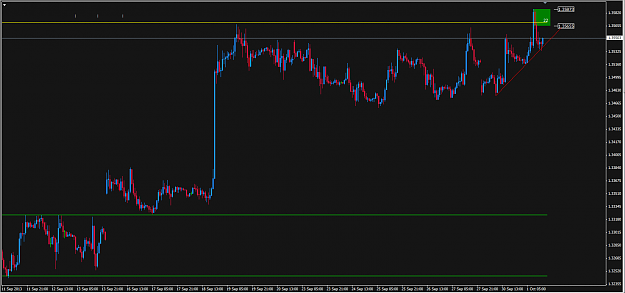
Hi traders, I have a H1 buy setup on USD/CAD. We are in an uptrend in Daily TF and has just broken Daily supply level with close above. also we have plenty of room until the opposing Daily supply zone with least resistance on the way up let's see...
Supply and demand in a nutshell by Alfonso Moreno
- caparzo replied Oct 3, 2013
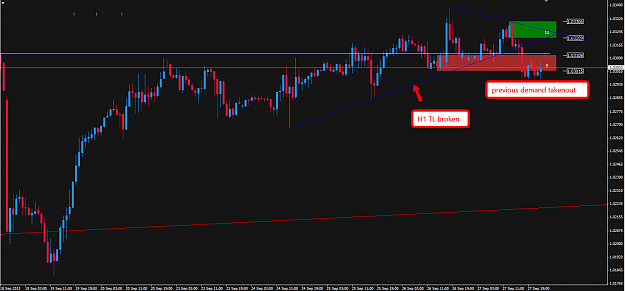
Hi to all, I have a buy setup on uk brent oil weekly/4h combo. we are at weekly CP demand. previous 4H downtrend line broken. loking to go long at new CP on 4H TF.
Supply and demand in a nutshell by Alfonso Moreno
- caparzo replied Oct 3, 2013
Hi myst1z and all traders, Levels that you draw look very good for me according to rules. However, even if we think that along with the Daily down trend, Daily demands should be taken out and supplys being respected, i personally dont continue to ...
Supply and demand in a nutshell by Alfonso Moreno
- caparzo replied Oct 1, 2013
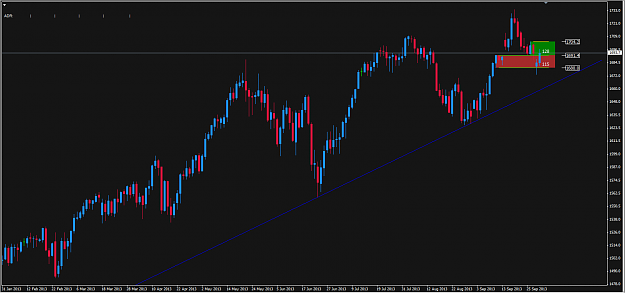
Hi Alfonso, on SP500 Daily chart; - absoluately we are still in uptrend, -TL is being respected along the way up, however the Brown coloured Daily zone has been taken over by supply zone, can we sell confirmation lowerTF short setups inside Daily ...
Supply and demand in a nutshell by Alfonso Moreno
- caparzo replied Oct 1, 2013
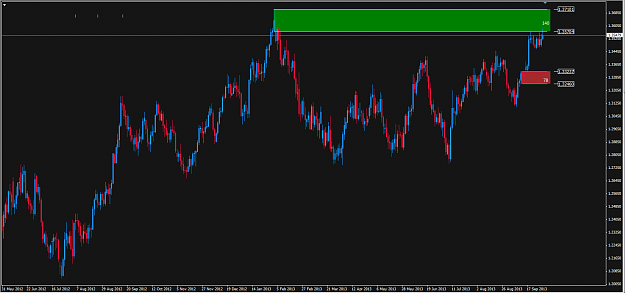
Hi to all, there is a EUR/USD H1 sell confirmation setup. we are inside Daily supply area. there is no need H1 TL to be broken to validate the H1 sell signal however it could have been nice to see. let's see.
Supply and demand in a nutshell by Alfonso Moreno
- caparzo replied Sep 30, 2013
Hi to all, i have a H1 sell CP setup on GBP/AUD. -Daily TL broken downward -We are inside Daily supply zone
Supply and demand in a nutshell by Alfonso Moreno
- caparzo replied Sep 29, 2013
Hi to all, i have a h1 sell setup on USD/CAD (10 pip zone) but i am abit concerned if the setup is abit aggressive or not, here is my setup.
Supply and demand in a nutshell by Alfonso Moreno
- caparzo replied Sep 27, 2013
Hi Alfonso, price couldn't make until there my friend, missed by 2 pips
Supply and demand in a nutshell by Alfonso Moreno

- caparzo replied Sep 26, 2013
Hi to all, on NZD/USD , there is a 1H buy setup at CP since we are bouncing from Daily demand level.
Supply and demand in a nutshell by Alfonso Moreno

- caparzo replied Sep 4, 2013
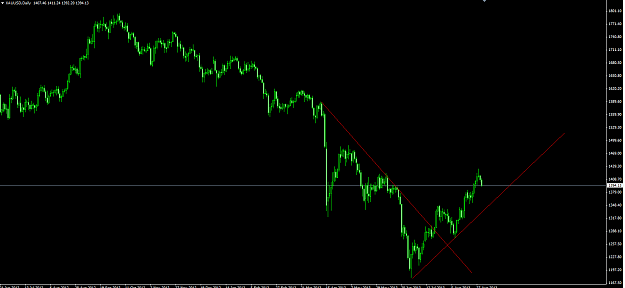
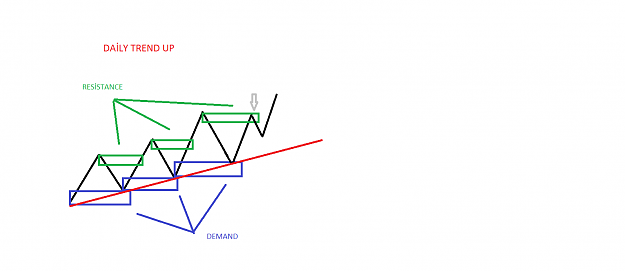
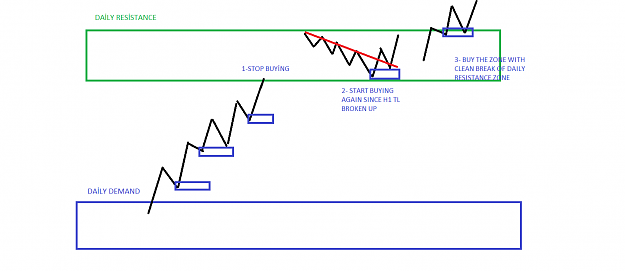
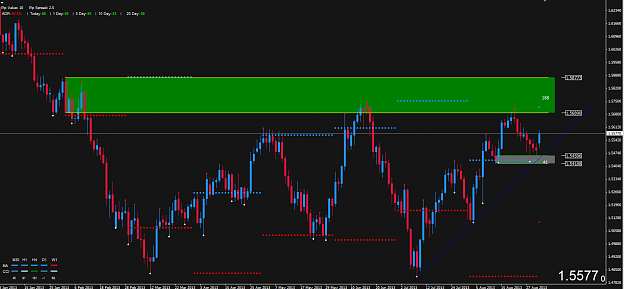
Hi guys and Alfonso, i want to know how u trade on areas of daily resistance zones. as shown on the chart, Daily trend is up and making HH-HLs. everytime price reaches Daily fresh demand levels we are allowed to buy on lower timeframe and we know ...
Supply and demand in a nutshell by Alfonso Moreno
- caparzo replied Sep 3, 2013
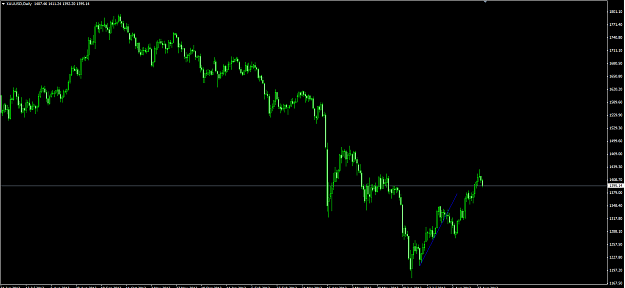
Hi guys On gold, we are bouncing from Daily demand zone along with the Daily trend. we had a H1 zone below but never reached there, now i am looking to go long on H1 speedbumb. let's see...
Supply and demand in a nutshell by Alfonso Moreno
- caparzo replied Sep 2, 2013
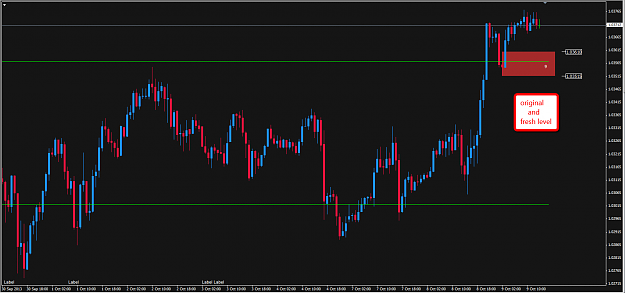
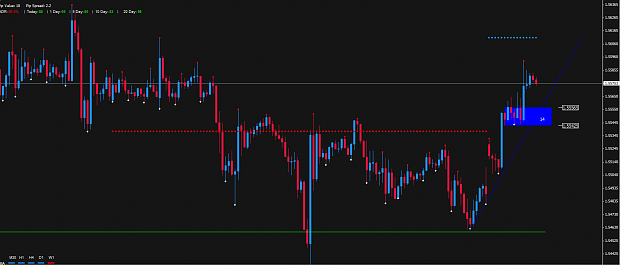
Hi guys, On GBP/USD D1 we are bouncing from original AND fresh demand level along the way with the trend. and on H1 chart i have drawn an original speedbumb demand zone. the only concern i have about this area is the time spent at that level. what ...
Supply and demand in a nutshell by Alfonso Moreno
- caparzo replied Aug 31, 2013
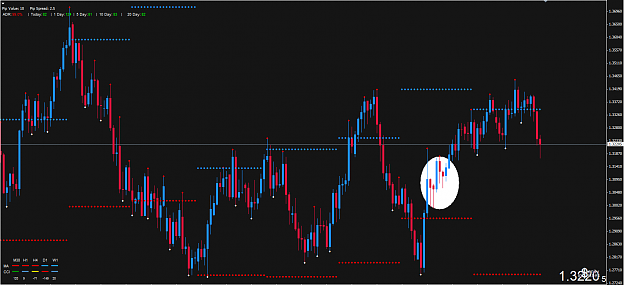
hi guys, i am abit confused about how to draw Demand areas on Daily chart of EUR/USD, at White circled area. can anybody help?
Supply and demand in a nutshell by Alfonso Moreno
- caparzo replied Aug 30, 2013
the second TL that u draw is H4 trend my friend, not the Daily. otherwise we should also have taken the blue line as Daily TL however, in the 3rd pic, to say Daily trend is down now, we dont need to wait till yellow TL to be broken, we can take ...
Supply and demand in a nutshell by Alfonso Moreno