- Search Forex Factory
- 26 Results
-
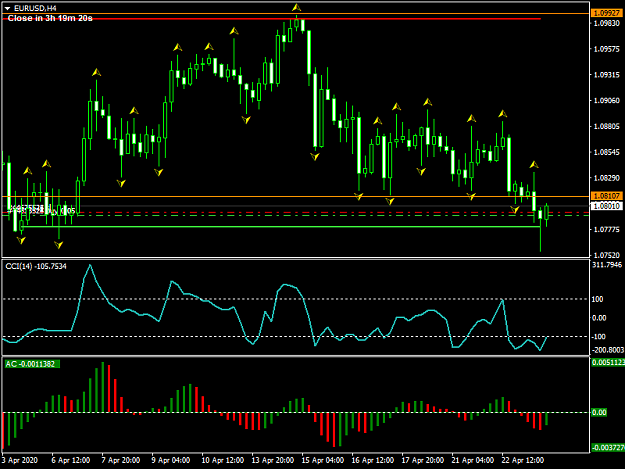
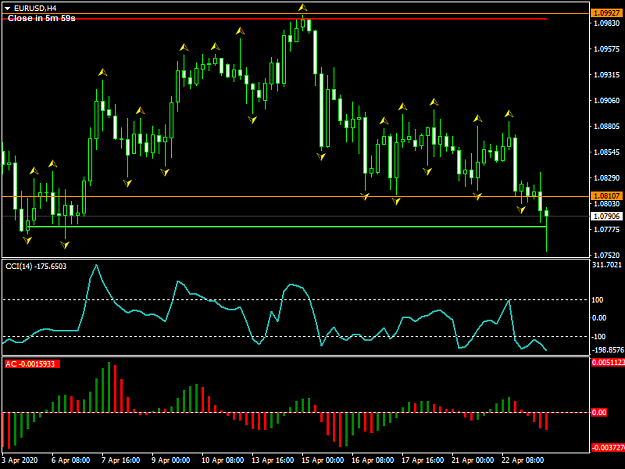
 calstock replied Apr 23, 2020
EurUsd New candle in five minutes.. Nice pin bar and just hanging around the last weeks low..
The Jail Break System
- calstock replied Apr 9, 2020
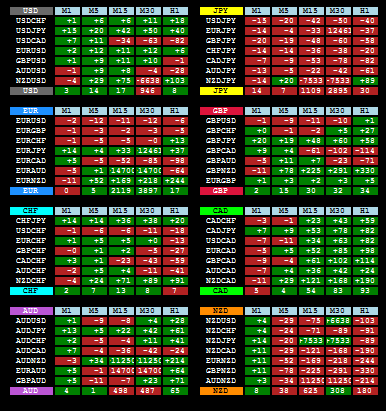
Just trading the weakness/strength of the USD, quick pips
The Jail Break System

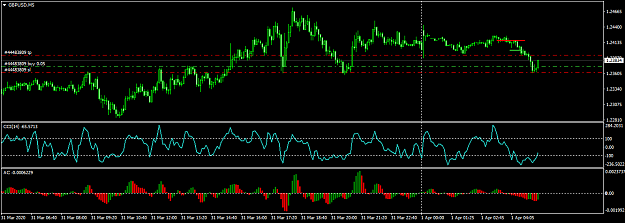
- calstock replied Mar 31, 2020
Spent last night watching the GBPUSD , then I realised that it was bouncing off the 200 Ma , waited for the four to close above and of course it didn't so I started to take the retraction away from the ma quick few pips on the five min charts.. ...
The Jail Break System
- calstock replied Mar 9, 2016
Honestknave, Firstly great Indicator, would it be possible to change the indicators from MA to CCI ? So a green box would be 100+ , Red 100-. With this setup (picture). Thanks
MADdash (Moving Average Distance)
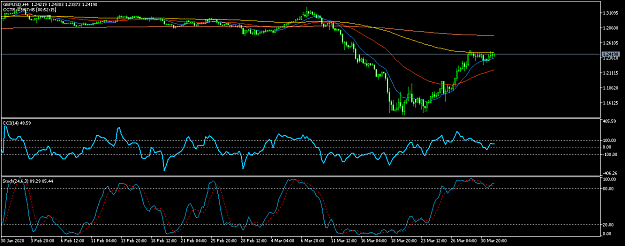
- calstock replied Jun 11, 2015
Looking at this chart using Low Volume , when it turns down the blue line should be the exit point ? If I understand the thread.
Low Volume Candles
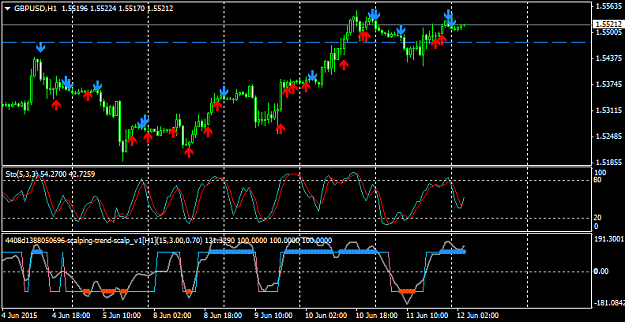
- calstock replied Nov 11, 2011
Ive noticed a lot of false signals.....three arrows in a row on the euro...take the break of the first one would have ended in a loss.. The Aud...never broke the signal candle.. The Atr was green at the time... Also got a sell on USDJPY....again a ...
Invictus
- calstock replied Aug 11, 2011
Once again...server problems.. And I still have had no reply regarding my post a few pages ago.. My news trade: where the server went off line and I was able to see my profit and the SL was not moving up...only to see when the server came back on ...
GoMarkets Discussion
- calstock replied Aug 6, 2011
It would appear that the best way to trade this scalp method would be to trade only with the short term trend, for the new traders anyway as trading retractments are at best dangerous. Therefore I have posted a indicator that may help with following ...
Box Scalping
- calstock replied Nov 6, 2010
Iam a trader not a teacher so Iam not the best at explaining myself, so i have copyied a page from a book I hope its not removed... Glenn
Trade What You See - Almost Naked Trading
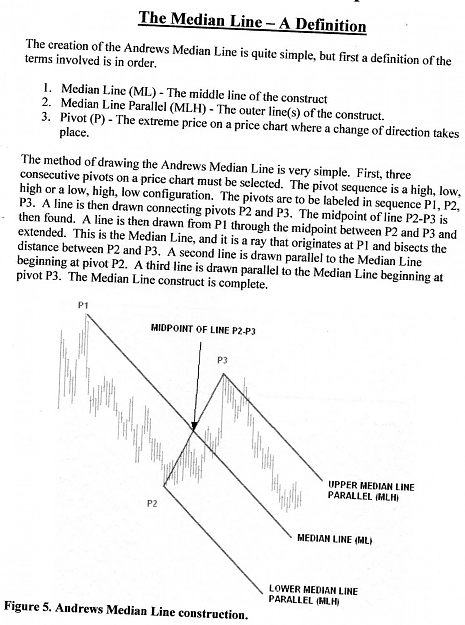
- calstock replied Nov 6, 2010
Same charts with a few comments.. Iam keeping this simple, therefore I do not want to get into the conversation regarding "Sliding Parallel lines,Warning Lines,Hagopian's rules or reverse Median lines... The Idea here is just to enhance this thread ...
Trade What You See - Almost Naked Trading
- calstock replied Nov 6, 2010
I will look at putting together a PDF file over the next few days, but in the mean time two charts to show the indicator and how it can be used on a chart, as you can see the upper/lower line are trendlines so all the Indicator is doing is showing ...
Trade What You See - Almost Naked Trading
- calstock replied Jun 10, 2010
Yes the Bollinger bands show what has happened as with most Indicators....now predicting Indicators.. I have several on file however what there based on is something I will have to look into... I do have one based on The VIX ( Volatility IndeX) it ...
Simple H1 GBPUSD EA
- calstock replied May 25, 2010
Yes Iam watching to see a bounce of the 197 ma.....the daily is showing a cross back down..... The trouble at the moment is theres so much uncertainty in the markets....add the posible intervention from Eurozone... Of course if she does cross on the ...
Simple H1 GBPUSD EA
- calstock replied May 19, 2010
This one was a breakout of the trendline red line... It maybe possible to code a EA to trade trendline breaks....May have to think about that one..
Simple H1 GBPUSD EA
- calstock replied May 19, 2010
When we all meet in Monte Carlo I thought it would be a good idea to do a bit of fishing....so I thought this may do us.. Ok I have to go make some money.....( to pay the bills ) see you later in the morning....
Simple H1 GBPUSD EA

- calstock replied May 13, 2010
Fair enough ( sorry my English humor )......No all are welcome.................see you in Monte carlo....
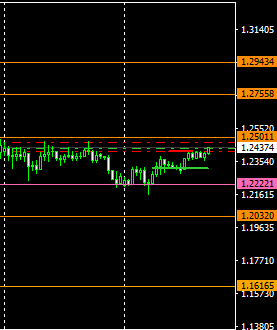
Simple H1 GBPUSD EA This is today....the red line is my view of were we are heading to.....lets see if it works....or if she retrace's....